 Back
BackComprehensive Study Notes for Statistics & Probability: Principles, Probability, Random Variables, Distributions, and Bivariate Analysis
Study Guide - Smart Notes
 Tailored notes based on your materials, expanded with key definitions, examples, and context.
Statistics, Data & Statistical Thinking
Introduction to Statistics
Statistics is the science of collecting, analyzing, interpreting, and presenting data. It provides tools and methods to understand the real world through data.
Statistics (discipline): Reasoning, tools, and methods for analyzing data.
Statistics (plural): Results of calculations made with data.
Data: Any collection of numbers, characters, images, or other items that provide information about something.
Statistical Methods
Descriptive Statistics: Collecting, presenting, and characterizing data.
Inferential Statistics: Making decisions or predictions about a population based on sample data.
Types of Data
Quantitative Data: Measured by numbers, often with units (e.g., weight, salary).
Qualitative (Categorical) Data: Describes groups or categories (e.g., hair color, campus).
Ordinal Variables: Categorical variables with a meaningful order but no natural units (e.g., survey ranks).
Identifier Variables: Unique identifiers for cases (e.g., student ID).
Sampling Techniques
Simple Random Sampling: Every sample of size n has an equal chance of selection.
Systematic Sampling: Selecting every kth unit.
Cluster Sampling: Sampling all units within randomly selected clusters.
Stratified Sampling: Sampling within identified subgroups (strata).
Convenience Sampling: Choosing samples that are easy to select.
Describing Data with Tables and Graphs
Describing Qualitative Data
Frequency Table: Lists categories and counts.
Pie Chart: Shows breakdown of total quantity into categories.
Bar Graph: Vertical bars for qualitative variables; height shows frequency or percentage.
Pareto Diagram: Bar graph with categories ordered by frequency.
Describing Quantitative Data
Stem-and-Leaf Display: Splits data into stems and leaves for visualization.
Histogram: Partitions data into bins; bars show frequency or relative frequency.
Numerical Measures of Central Tendency
Mean (x̄): Arithmetic average; sensitive to outliers.
Median: Middle value; resistant to outliers.
Mode: Most frequent value; can be used for quantitative or qualitative data.
Numerical Measures of Variability
Range: Difference between largest and smallest values.
Variance (s²): Average squared deviation from the mean.
Standard Deviation (s): Square root of variance; measures spread.
Coefficient of Variation: Ratio of standard deviation to mean.
Shape of a Distribution
Symmetric: Mean = Median.
Right-Skewed: Mean > Median.
Left-Skewed: Mean < Median.
Five-Number Summary & Boxplot
Minimum, Q1, Median, Q3, Maximum.
Boxplots visualize these values and detect outliers.
Measures of Relative Standing
z-Score: Number of standard deviations a value is from the mean.
Percentiles: Value below which a given percentage of data falls.
Quartiles: Q1 (25th), Q2 (Median, 50th), Q3 (75th).
Interquartile Range (IQR): Q3 - Q1; spread of middle 50%.
Probability
Basic Principles
Probability quantifies uncertainty and is foundational to statistical inference.
Random Phenomenon: Situation with uncertain outcomes.
Trial: Single observation of a random phenomenon.
Outcome: Result of a trial.
Sample Space: Set of all possible outcomes.
Event: Combination of outcomes.
Probability Rules
Rule 1: 0 ≤ P(A) ≤ 1
Rule 2: P(Sample Space) = 1
Rule 3 (Complement): P(AC) = 1 - P(A)
Rule 4 (Addition): For disjoint events, P(A or B) = P(A) + P(B)
Rule 5 (Multiplication): For independent events, P(A and B) = P(A) × P(B)
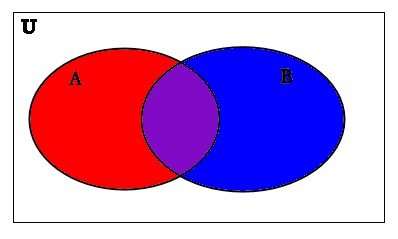
General Addition Rule
For any two events A and B:
Conditional Probability
Probability of B given A has occurred.
Independence
Events A and B are independent if and .
Tree Diagrams
Tree diagrams visually represent sequences of events and their probabilities. 
Bayes' Rule
Used to reverse conditioning.
Describing Data Numerically
Contingency Tables
Contingency tables organize counts for combinations of two categorical variables.
Rows: Variable 1
Columns: Variable 2
Marginal Distribution: Totals for each variable
Conditional Distribution: Distribution of one variable given a category of the other
Discrete Random Variables & Probability Distributions
Random Variables
Random Variable: Numerical value from a random experiment.
Discrete Random Variable: Takes countable values.
Continuous Random Variable: Takes any value within a range.
Probability Model
Collection of all possible values and their probabilities.
Requirements: for all x,
Expected Value and Standard Deviation
Variance:
Standard Deviation:
Bernoulli Trials
Two outcomes: success (p), failure (q = 1-p)
Trials are independent
Combinations Formula
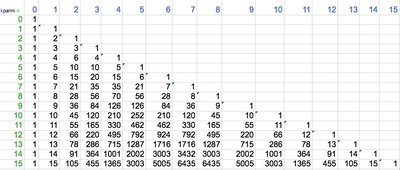
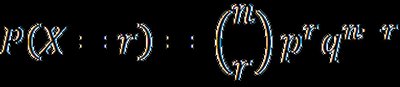
Binomial Distribution
Number of successes in n Bernoulli trials
Expected value:
Standard deviation:
Poisson Distribution
Number of rare events in an interval
Mean:
Standard deviation:
Bivariate Analysis – Correlation & Regression
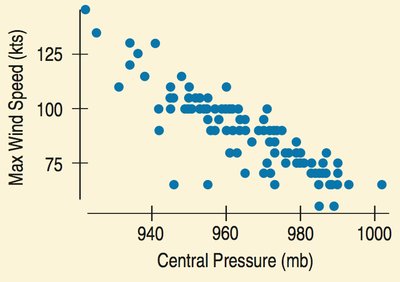
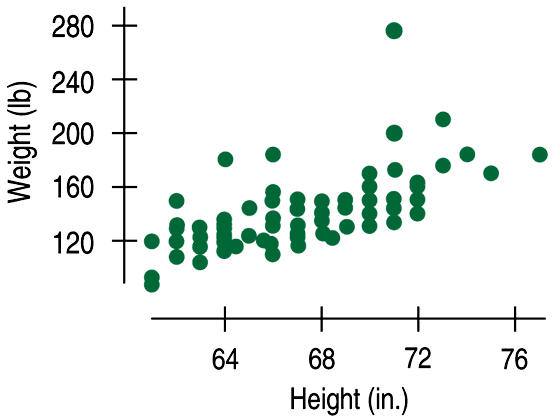
Scatterplots and Association
Scatterplots visualize the relationship between two quantitative variables.
Explanatory Variable (X): Predictor
Response Variable (Y): Predicted
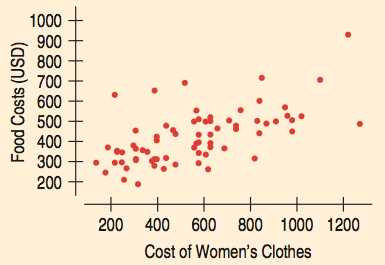
Describing Scatterplots
Direction: Positive, negative, or none
Shape: Linear, curved, clusters
Strength: Strong, moderate, weak
Unusual Features: Outliers, clusters
Correlation
Correlation coefficient (r): Measures linear association, ranges from -1 to 1
Conditions: Quantitative variables, linear relationship, no outliers
Correlation does not imply causation
Linear Regression
Regression line:
(slope)
(intercept)
Interpolation: Predicting within domain
Extrapolation: Predicting outside domain (use caution)
Least Squares Method & Residuals
Residual: Difference between observed and predicted value ()
Line of best fit minimizes sum of squared residuals
(coefficient of determination): Proportion of variation explained by model
Residual Analysis
Residuals should be randomly scattered, no pattern
Standard error of regression (se): Measures typical deviation from regression line
Bivariate Analysis – Contingency Tables
Contingency Tables
Organize counts for two categorical variables
Marginal and conditional distributions
Row and column percentages
Visualized with segmented bar charts and pie charts
Independence in Contingency Tables
Variables are independent if conditional distributions are similar across categories
Chi-Square Tests & Cramer's V
Chi-squared statistic: Measures association in contingency tables
Cramer's V: Scaled measure of association, ranges from 0 (independent) to 1 (perfect association)
Simpson's Paradox
Trend observed in groups disappears when groups are combined due to a lurking variable
Summary Table: Types of Data and Analysis
Type of Data | Graphical Methods | Numerical Methods |
|---|---|---|
Qualitative (Categorical) | Pie Chart, Bar Graph, Pareto Diagram | Frequency, Mode |
Quantitative | Histogram, Stem-and-Leaf, Boxplot | Mean, Median, Mode, Range, Variance, SD, IQR, z-score |
Key Formulas
Mean:
Variance:
Standard Deviation:
z-score:
Binomial Probability:
Poisson Probability:
Conditional Probability:
Regression Line:
Correlation:
