 Back
Confidence Intervals and Estimation in Introductory Statistics
Study Guide - Smart Notes
 Tailored notes based on your materials, expanded with key definitions, examples, and context.
Estimating the Value of a Parameter
Point Estimates
A point estimate is a single value calculated from sample data that serves as an estimate of a population parameter. For example, the point estimate for the population proportion is given by:
Sample Proportion: , where is the number of individuals in the sample with a specified characteristic and is the sample size.
Sample Mean: is a point estimate of the population mean .
Example: In a poll of 1015 Americans, 458 said their federal income tax is too high. The point estimate for the proportion is .
Confidence Intervals for Population Proportion
Definition and Interpretation
A confidence interval for an unknown parameter consists of an interval of numbers based on a point estimate. The level of confidence represents the expected proportion of intervals that will contain the parameter if many samples are taken. For example, a 95% confidence level () means that 95 out of 100 intervals will contain the parameter.
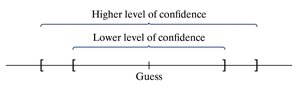
Sampling Distribution: The distribution of sample proportions is approximately normal if the sample size is no more than 5% of the population and data are random.
Mean:
Standard Error:
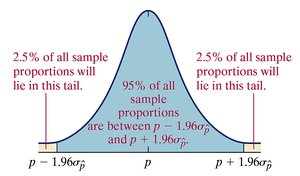
For a 95% confidence interval, 95% of all sample proportions will lie within 1.96 standard deviations of the population proportion, and 2.5% will lie in each tail.
Margin of Error
The margin of error for a 95% confidence interval for the population proportion is:
The confidence interval is
Increasing the level of confidence increases the margin of error, resulting in a wider interval.
Critical Values
The critical value represents the number of standard deviations the sample statistic can be from the parameter and still result in an interval that includes the parameter. Higher confidence levels correspond to higher critical values.
Constructing a Confidence Interval for a Population Proportion
To construct a confidence interval for :
Lower bound:
Upper bound:
Example: In a survey of 800 teens, 272 text while driving. . For a 95% confidence interval, calculate the margin of error and bounds.
Sample Size for Estimating Proportion
The sample size required for a specified margin of error and confidence level is:
If prior estimate is available:
If no prior estimate:
Example: To estimate a proportion within 2 percentage points (0.02) with 90% confidence, use the formulas above.
Confidence Intervals for Population Mean
Point Estimate of the Mean
The sample mean is a point estimate of the population mean .
Student’s t-Distribution
When the population standard deviation is unknown and the sample size is small, the distribution of follows Student’s t-distribution with degrees of freedom. The t-distribution is centered at 0, symmetric, and has more spread than the normal distribution, especially for small sample sizes.
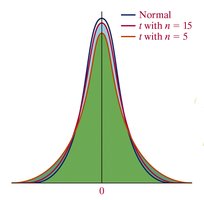
As sample size increases, the t-distribution approaches the normal distribution.
The area in the tails is greater for t-distribution due to increased variability.
Constructing a Confidence Interval for the Mean
Requirements:
Simple random sample
Sample size small relative to population
Population is normally distributed or sample size is large
The confidence interval is:
Lower bound:
Upper bound:
The margin of error is .
Normality Condition
Before using the t-distribution, verify that the sample data are approximately normal:
For : Use a normal probability plot and boxplot to check for normality and outliers.
For : Data should be symmetric with no outliers.
For : Data should not have extreme skewness or outliers.
For : t-distribution can be used even for skewed distributions (Central Limit Theorem).
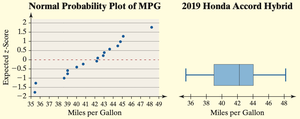
Example: For 16 Honda Accord Hybrid cars, the normal probability plot and boxplot show no outliers and approximate normality, so t-distribution is appropriate.
Constructing a Confidence Interval: Example
Given sample mean , sample standard deviation , and sample size , use the t-distribution to calculate the confidence interval.
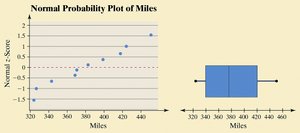
Example: For 10 Buick Enclave cars, , , . For a 95% confidence interval, calculate bounds using with 9 degrees of freedom.
Sample Size for Estimating the Mean
The sample size required to estimate the population mean with margin of error and confidence level is:
(rounded up)
Example: To estimate mean miles per gallon within 0.5 mpg with 95% confidence, substitute values into the formula above.
Summary Table: Confidence Interval Construction
Parameter | Point Estimate | Interval Formula | Distribution |
|---|---|---|---|
Proportion () | Normal | ||
Mean () | t-distribution |
Additional info: The notes above expand on brief points with academic context, definitions, and examples to ensure completeness and clarity for exam preparation.
