 Back
BackConfidence Intervals for Means and the Central Limit Theorem
Study Guide - Smart Notes
 Tailored notes based on your materials, expanded with key definitions, examples, and context.
Confidence Intervals for Means
Introduction to Confidence Intervals
Confidence intervals provide a range of plausible values for a population parameter, such as the mean, based on sample data. They are fundamental tools in inferential statistics, allowing us to estimate population characteristics with a quantifiable level of certainty.
Parameter (\(\mu\)): The true mean of the population (e.g., the average number of M&Ms in all fun-sized bags).
Variable: The measured quantity in each sample (e.g., number of M&Ms in a bag).
Population: The entire group of interest (e.g., all fun-sized bags of M&Ms).
Sample: A subset of the population used to estimate the parameter.
Key Question: How can we estimate the population mean when it is unknown? We use a confidence interval for the mean.
Sampling Distributions and the Central Limit Theorem (CLT)
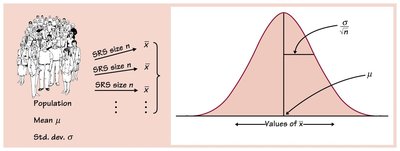
Sampling Distribution of the Mean
The sampling distribution of the mean is the distribution of sample means from all possible samples of a given size drawn from the population. This distribution has important properties:
Shape: Depends on the population distribution and sample size.
Center: The mean of the sampling distribution equals the population mean (\(\mu\)).
Spread: The standard deviation of the sampling distribution (standard error) is \(\frac{\sigma}{\sqrt{n}}\), where \(\sigma\) is the population standard deviation and \(n\) is the sample size.
Definition: The standard deviation of the sampling distribution is called the standard error and measures sampling variability.
The Central Limit Theorem (CLT)
The Central Limit Theorem is a foundational result in statistics. It states that, regardless of the population's distribution, the sampling distribution of the sample mean approaches a Normal distribution as the sample size increases, provided the samples are independent and randomly collected.
Randomness: Samples must be randomly collected and independent.
Sample Size: The larger the sample size, the more closely the sampling distribution approximates Normality.
Population Shape: For Normal populations, any sample size works. For skewed or unknown populations, larger samples are needed for the Normal approximation to hold.
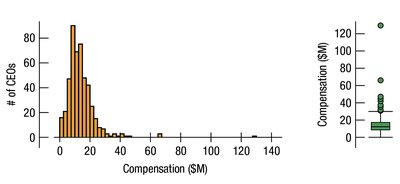
Example: The distribution of CEO compensations is strongly right-skewed. As sample size increases, the sampling distribution of the mean becomes more Normal.
Visualizing the Effect of Sample Size
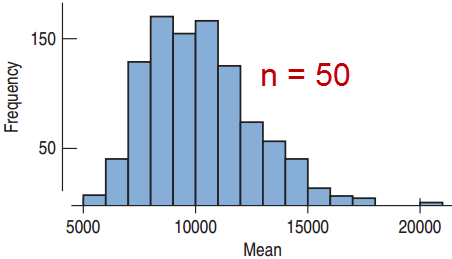
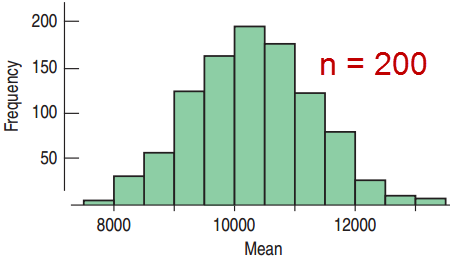
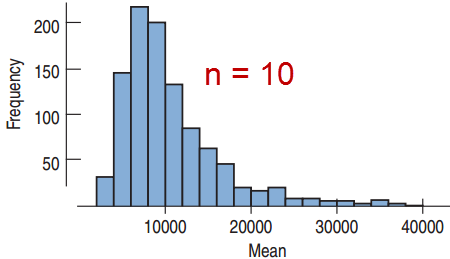
As the sample size increases, the sampling distribution of the mean becomes more symmetric and bell-shaped, even if the population distribution is skewed.
Small sample size (n = 10): The sampling distribution is still skewed.
Moderate sample size (n = 50, 100): The distribution becomes more symmetric.
Large sample size (n = 200): The distribution is approximately Normal.

General Guidelines:
For slightly skewed populations: n > 15–40 is often sufficient.
For very skewed or unknown populations: n > 40 is recommended.
Conditions for Using the Normal Model for Sample Means
Before applying the Normal model to the sampling distribution of the mean, check these conditions:
Random Condition: The sample must be a simple random sample (SRS) or randomly assigned treatment.
10% Condition: The sample size should be less than 10% of the population size to ensure independence.
Sufficiently Large Sample Size: For Normal populations, any n works. For skewed populations, larger n is needed (see CLT).
Mathematical Summary
When the above conditions are met, the sampling distribution of the mean is:
Key Takeaways
The mean of the sampling distribution equals the population mean (\(\mu\)).
The standard deviation of the sampling distribution (standard error) is \(\frac{\sigma}{\sqrt{n}}\).
The sampling distribution becomes more Normal as n increases, regardless of the population's shape.
Conceptual Questions
True or False: The CLT states that the sampling distribution of the sample mean is approximately Normal for any n, as long as the observations are independent. Answer: False. For non-Normal populations, a sufficiently large n is required.
Application: For a strongly right-skewed population, increasing the sample size makes the sampling distribution of the mean more Normal and reduces its variability.
Population Distribution | Sampling Distribution Shape | Sample Size Guideline |
|---|---|---|
Normal | Normal | Any n |
Slightly Skewed | Normal (with larger n) | 15 < n < 40 |
Very Skewed or Unknown | Normal (with much larger n) | n > 40 |
Additional info: The Central Limit Theorem is sometimes called the "Fundamental Theorem of Statistics" because it justifies the use of Normal-based inference for means in a wide variety of practical situations.
