 Back
Constructing a Boxplot from a Sample
Study Guide - Smart Notes
 Tailored notes based on your materials, expanded with key definitions, examples, and context.
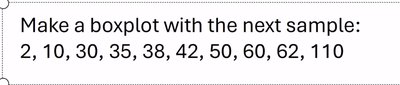
Q1. Make a boxplot with the following sample: 2, 10, 30, 35, 38, 42, 50, 60, 62, 110
Background
Topic: Descriptive Statistics – Boxplots
This question tests your ability to summarize a quantitative data set using a boxplot, which visually displays the distribution, central tendency, spread, and potential outliers.
Key Terms and Formulas
Boxplot: A graphical summary of a data set showing the minimum, first quartile (Q1), median (Q2), third quartile (Q3), maximum, and any outliers.
Quartiles: Values that divide the data into four equal parts.
Interquartile Range (IQR):
Outlier: Any value below or above
Step-by-Step Guidance
Order the data from smallest to largest: 2, 10, 30, 35, 38, 42, 50, 60, 62, 110.
Identify the minimum and maximum values in the sample.
Find the median (Q2) of the data set. Since there are 10 values, the median is the average of the 5th and 6th values.
Calculate the first quartile (Q1): Find the median of the lower half (first 5 values).
Calculate the third quartile (Q3): Find the median of the upper half (last 5 values).
Compute the interquartile range (IQR) using .
Determine if there are any outliers using the formulas for lower and upper fences.
Set up the boxplot by marking the minimum, Q1, median, Q3, and maximum (or the highest non-outlier value), and indicate any outliers.
Try solving on your own before revealing the answer!
Final Answer:
Minimum: 2 Q1: 16 Median (Q2): 40 Q3: 56 Maximum (non-outlier): 62 Outlier: 110
The boxplot will have a box from Q1 (16) to Q3 (56), with a line at the median (40). Whiskers extend from the minimum (2) to the maximum non-outlier (62). The value 110 is plotted as an outlier.
This boxplot visually summarizes the spread and central tendency of the sample, and highlights the presence of an outlier.
