 Back
BackConstructing and Interpreting a Probability Distribution for Discrete Random Variables
Study Guide - Smart Notes
 Tailored notes based on your materials, expanded with key definitions, examples, and context.
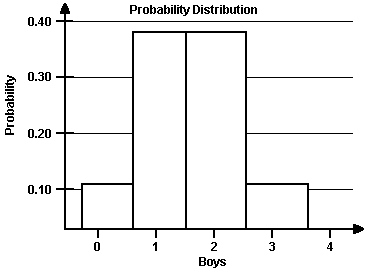
Q6. The random variable x represents the number of boys in a family of three children. Assuming that boys and girls are equally likely, (a) construct a probability distribution, and (b) graph the probability histogram.
Background
Topic: Discrete Probability Distributions & Binomial Distribution
This question tests your understanding of how to construct a probability distribution for a discrete random variable, specifically using the binomial distribution. It also asks you to represent the distribution visually as a histogram.
Key Terms and Formulas
Discrete Random Variable: A variable that can take on a countable number of distinct values.
Binomial Distribution: Used when there are a fixed number of independent trials, each with two possible outcomes (success/failure).
Probability Mass Function for Binomial:
= number of trials (children = 3)
= number of successes (number of boys)
= probability of success (boy = 0.5)
Step-by-Step Guidance
Identify the possible values for : Since there are three children, $x$ can be 0, 1, 2, or 3 (number of boys).
Use the binomial formula to calculate for each value of :
For :
For :
For :
For :
Calculate each probability value using the formula above, but do not compute the final numeric values yet.
Once you have the probabilities, organize them into a table with and .
Draw a probability histogram using the values from your table. The histogram should have (number of boys) on the horizontal axis and (probability) on the vertical axis.
Try solving on your own before revealing the answer!
