 Back
BackContinuous Random Variables, Normal Distribution, and Sampling Distributions: Study Notes
Study Guide - Smart Notes
 Tailored notes based on your materials, expanded with key definitions, examples, and context.
Continuous Random Variables and Probability Distributions
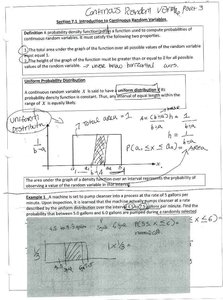
Introduction to Continuous Random Variables
A continuous random variable is a variable that can take any value within a given interval. Its probability distribution is described by a probability density function (pdf), which must satisfy two key properties:
The total area under the graph of the function over all possible values equals 1.
The function is never negative for any value of the random variable.
Probabilities for continuous random variables are found as areas under the curve of the pdf between two values.
Uniform Probability Distribution
A uniform probability distribution is a special case where all intervals of equal length within the range are equally likely. The pdf is constant between two endpoints, a and b.
Probability density function: for
Probability that falls between and :
Example: If is uniformly distributed between 4 and 6, then for .
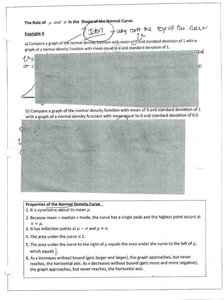
Normal Distribution
Definition and Properties
A normal distribution is a continuous probability distribution that is symmetric about its mean, with its shape defined by the mean () and standard deviation (). The graph is bell-shaped and described by the equation:
Mean = median = mode
Inflection points occur at
Total area under the curve is 1
The normal distribution is used extensively in statistics due to the Central Limit Theorem.
Standard Normal Distribution and Z-Scores
The standard normal distribution is a normal distribution with mean 0 and standard deviation 1. Any normal random variable can be converted to a standard normal variable using:
Z-scores allow comparison of values from different normal distributions and are used to find probabilities using standard normal tables.
Finding Probabilities for Normal Random Variables
To find probabilities for a normal random variable with mean and standard deviation :
Convert to using
Use the standard normal table or calculator to find the area (probability) corresponding to
For intervals:
Properties of the Normal Density Curve
Symmetric about the mean
Single peak at the mean
Area under the curve is 1
As moves further from the mean, the curve approaches but never touches the horizontal axis
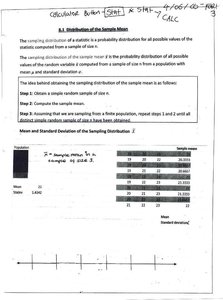
Sampling Distributions
Distribution of the Sample Mean
The sampling distribution of the sample mean is the probability distribution of all possible values of the sample mean from samples of size drawn from a population with mean and standard deviation .
Mean of the sampling distribution:
Standard deviation (standard error):
As increases, the sampling distribution becomes more concentrated around the population mean.
The Central Limit Theorem (CLT)
The Central Limit Theorem states that, regardless of the population's shape, the sampling distribution of the sample mean approaches a normal distribution as the sample size increases (typically is considered sufficient).
If the population is normal, the sample mean is always normally distributed.
If the population is not normal, the sample mean is approximately normal for large .
Distribution of the Sample Proportion
The sample proportion is the proportion of individuals in a sample with a specified characteristic. For large enough samples, the sampling distribution of $\hat{p}$ is approximately normal:
Mean:
Standard deviation:
Conditions for normality: and
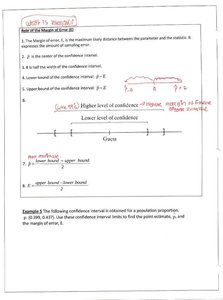
Confidence Intervals
Estimating a Population Proportion
A confidence interval for a population proportion is an interval estimate based on a sample proportion :
Formula:
is the critical value from the standard normal distribution for the desired confidence level
The margin of error is
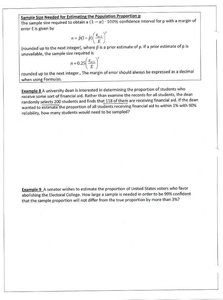
Sample Size for Estimating a Proportion
The sample size required to estimate a population proportion with margin of error at confidence level is:
If no prior estimate for is available, use for maximum sample size.
Estimating a Population Mean
For a population mean , the confidence interval depends on whether the population standard deviation is known:
If is known:
If is unknown: use the Student's t-distribution:
Where is the sample standard deviation and is the degrees of freedom.
Properties of the t-Distribution
Symmetric and bell-shaped, but with heavier tails than the normal distribution
As sample size increases, the t-distribution approaches the normal distribution
Used when estimating the mean from small samples () and is unknown
Sample Size for Estimating a Mean
The sample size required to estimate a population mean with margin of error at confidence level is:
Round up to the nearest whole number.
Summary Table: Key Formulas
Parameter | Point Estimate | Standard Error | Confidence Interval |
|---|---|---|---|
Population Mean () | or | or | |
Population Proportion () |
Additional info: These notes cover continuous random variables, the normal and t-distributions, sampling distributions, and confidence intervals, which are central topics in introductory statistics courses.
