 Back
BackCorrelation and Linear Regression: Understanding the Linear Correlation Coefficient (r)
Study Guide - Smart Notes
 Tailored notes based on your materials, expanded with key definitions, examples, and context.
Correlation and Linear Relationships
Definitions and Basic Concepts
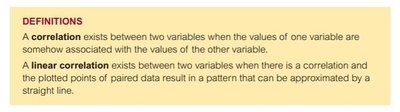
Correlation is a fundamental concept in statistics that describes the association between two variables. When the values of one variable are somehow associated with the values of another, a correlation exists. A linear correlation is a specific type of correlation where the plotted points of paired data result in a pattern that can be approximated by a straight line.
Correlation: Exists between two variables when their values are associated.
Linear correlation: Exists when the association forms a straight-line pattern in a scatterplot.
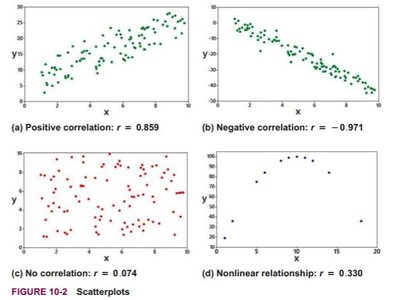
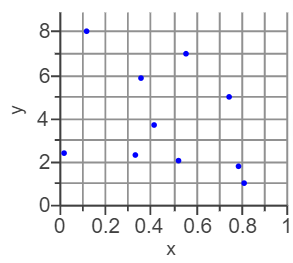
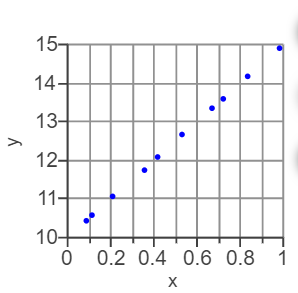
Interpreting Scatterplots
Scatterplots are graphical tools used to visualize the relationship between two quantitative variables. They help determine the type and strength of correlation present.
Positive linear correlation: As x increases, y also increases. The points form an upward-sloping straight line.
Negative linear correlation: As x increases, y decreases. The points form a downward-sloping straight line.
No correlation: No distinct pattern; the points are scattered randomly.
Nonlinear relationship: The association exists but is not linear; points may form a curve or other pattern.
The Linear Correlation Coefficient (r)
Definition and Interpretation
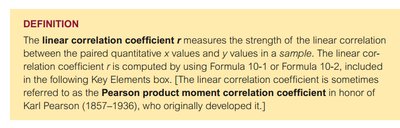
The linear correlation coefficient (r) measures the strength and direction of the linear correlation between paired quantitative x and y values in a sample. It is also known as the Pearson product moment correlation coefficient.
r: Measures linear correlation in a sample.
ρ (rho): Measures linear correlation in a population.
r is computed using specific formulas and is typically calculated using statistical software.
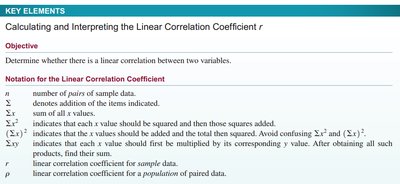
Notation and Calculation
To calculate and interpret the linear correlation coefficient r, certain notations are used:
n: Number of pairs of sample data.
Σx, Σy: Sum of all x values and y values, respectively.
Σx², Σy²: Sum of squared x values and squared y values.
Σxy: Sum of products of paired x and y values.
r: Linear correlation coefficient for sample data.
ρ: Linear correlation coefficient for population data.
Requirements for Using r
Before calculating r, certain requirements must be met to ensure valid results:
The sample of paired (x, y) data must be a simple random sample of quantitative data.
Visual examination of the scatterplot must confirm that the points approximate a straight-line pattern.
Outliers must be considered, as they can strongly affect the value of r.
For formal inference, the paired data should have a bivariate normal distribution.
Formula for Calculating r
The formula for the linear correlation coefficient r is:
Properties of the Linear Correlation Coefficient r
The linear correlation coefficient r has several important properties:
The value of r is always between -1 and 1 inclusive ().
Changing the scale of either variable does not affect r.
Interchanging x and y does not change r.
r measures only linear relationships, not nonlinear ones.
r is sensitive to outliers; a single outlier can dramatically affect its value.
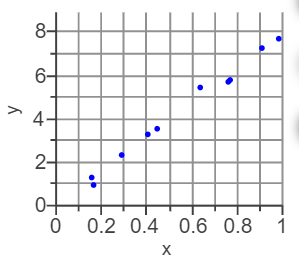
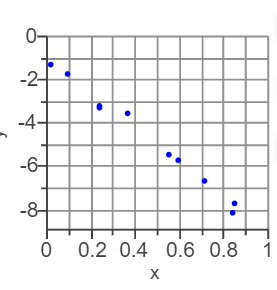
Examples: Matching Scatterplots to Correlation Coefficients
Scatterplots can be matched to their corresponding correlation coefficients based on the pattern and direction of the data:
r = -0.90: Strong negative linear correlation.
r = 1.00: Perfect positive linear correlation.
r = -0.33: Weak negative linear correlation.
r = 0.90: Strong positive linear correlation.
Interpreting r and Explained Variation
Explained Variation (r²)
If a linear correlation exists, a linear equation can be used to predict y from x. The value of r² (coefficient of determination) represents the proportion of variation in y explained by the linear relationship with x.
When r² is close to 1, most of the variation in y is explained by the linear relationship.
When r² is close to 0, most of the variation in y is not explained by the linear relationship.
r² is often expressed as a percentage (0% to 100%).
Correlation Does Not Imply Causation
Even when a linear correlation is found, it does not imply causation. Other variables (lurking variables) may influence the relationship. For example, finding a correlation between chocolate consumption and Nobel Laureates does not mean chocolate causes Nobel Prizes.
Lurking variables: Variables not included in the study that may affect the results.
Common errors: Assuming causality, using averages (which may inflate r), and ignoring nonlinear relationships.
Summary Table: Types of Correlation and Their Characteristics
Type of Correlation | Scatterplot Pattern | r Value | Interpretation |
|---|---|---|---|
Positive Linear | Upward-sloping straight line | r > 0 (close to 1) | As x increases, y increases |
Negative Linear | Downward-sloping straight line | r < 0 (close to -1) | As x increases, y decreases |
No Correlation | No distinct pattern | r ≈ 0 | No association between x and y |
Nonlinear Relationship | Curved or other pattern | r may be moderate | Association exists but is not linear |
Additional info: The notes above expand on the original content by providing definitions, properties, examples, and a summary table for clarity. All included images directly reinforce the explanation of scatterplots and correlation coefficients.
