 Back
Correlation and Regression: Study Notes for Introductory Statistics
Study Guide - Smart Notes
 Tailored notes based on your materials, expanded with key definitions, examples, and context.
Correlation and Regression
Introduction to Correlation
Correlation is a fundamental concept in statistics that describes the relationship between two variables. In this context, data are often represented as ordered pairs (x, y), where x is the independent (explanatory) variable and y is the dependent (response) variable.
Correlation: A relationship between two variables, which can be visualized using scatter plots.
Independent variable (x): The variable that is manipulated or categorized.
Dependent variable (y): The variable that is measured or observed.
Scatter plot: A graphical representation used to determine whether a linear (straight line) correlation exists between two variables.
Ordered pairs: Each data point is represented as (x, y).
Types of Correlation
There are several types of correlation, each describing a different kind of relationship between variables:
Positive Linear Correlation: As x increases, y tends to increase.
Negative Linear Correlation: As x increases, y tends to decrease.
No Correlation: No discernible relationship between x and y.
Nonlinear Correlation: The relationship between x and y is not linear.
Example: Constructing a Scatter Plot
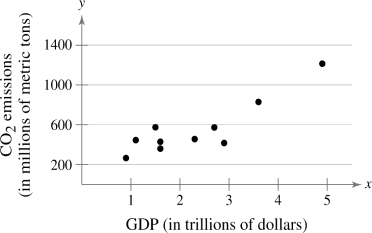
An economist wants to determine whether there is a linear relationship between a country’s gross domestic product (GDP) and carbon dioxide (CO2) emissions. The data are shown in the table below. Displaying the data in a scatter plot helps determine whether there appears to be a positive or negative linear correlation or no linear correlation.
GDP (trillions of $): 1.6, 3.6, 4.9, 1.1, 0.9, 2.9, 2.7, 2.3, 1.6, 1.5
CO2 emission (millions of metric tons): 428.2, 828.8, 1214.2, 444.6, 264.0, 415.3, 571.8, 454.9, 358.7, 573.5
Conclusion: The scatter plot shows a positive linear correlation. As GDP increases, CO2 emissions tend to increase.
Correlation Coefficient
The correlation coefficient is a measure of the strength and direction of a linear relationship between two variables. The sample correlation coefficient is denoted by r, and the population correlation coefficient is denoted by \rho (rho).
Range of r: -1 to 1
r = -1: Perfect negative correlation
r = 1: Perfect positive correlation
r ≈ 0: No linear correlation
Formula for the sample correlation coefficient r:
n: Number of data pairs
Examples of Correlation Coefficient Values
Strong negative correlation: r = -0.91
Strong positive correlation: r = 0.88
Weak positive correlation: r = 0.42
Nonlinear correlation: r = 0.07
Using Technology to Find a Correlation Coefficient
Statistical software or calculators can be used to compute the correlation coefficient. For example, using technology to analyze the Old Faithful geyser data yields r ≈ 0.979, indicating a strong positive correlation.
Procedure: Enter data, use the DiagnosticOn command, and calculate r.
Interpretation: A value close to 1 or -1 suggests a strong linear relationship.
Correlation and Causation
It is important to distinguish between correlation and causation. A strong correlation does not necessarily imply a cause-and-effect relationship. Several possibilities should be considered:
Direct cause-and-effect: Does x cause y?
Reverse cause-and-effect: Does y cause x?
Third variable: Is the relationship caused by another variable or a combination of variables?
Coincidence: Is the relationship merely coincidental?
Summary of Section 9.1
Introduced linear correlation, independent and dependent variables, and types of correlation
Found a correlation coefficient
Tested a population correlation coefficient \rho using a table
Performed a hypothesis test for a population correlation coefficient \rho
Distinguished between correlation and causation
