 Back
BackCorrelation and the Linear Correlation Coefficient (r)
Study Guide - Smart Notes
 Tailored notes based on your materials, expanded with key definitions, examples, and context.
Correlation and Regression
Basic Concepts of Correlation
Correlation is a statistical measure that describes the association between two variables. Understanding correlation is essential for analyzing how variables relate to each other, especially when visualized in scatterplots.
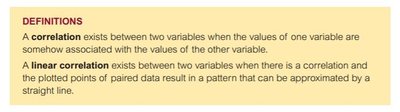
Correlation: Exists when the values of one variable are somehow associated with the values of another variable.
Linear Correlation: Exists when the association between two variables can be approximated by a straight line in a scatterplot of paired data.
Interpreting Scatterplots
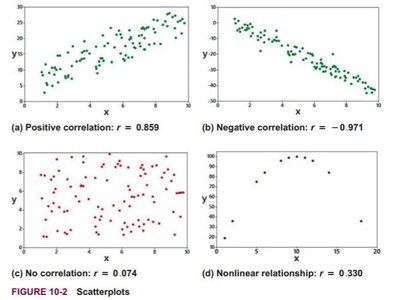
Scatterplots are graphical tools used to visualize the relationship between two quantitative variables. The pattern of the points can reveal the type and strength of correlation:
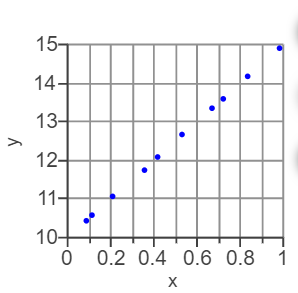
Positive Linear Correlation: As x increases, y also increases. The points form an upward-sloping line.
Negative Linear Correlation: As x increases, y decreases. The points form a downward-sloping line.
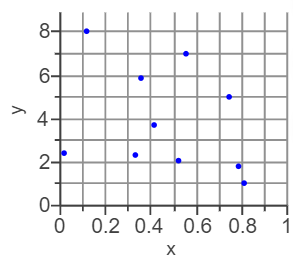
No Correlation: The points do not show any clear pattern.
Nonlinear Relationship: The points show a pattern, but it is not linear (e.g., curved).
Measuring Linear Correlation: The Correlation Coefficient r
Definition of the Linear Correlation Coefficient
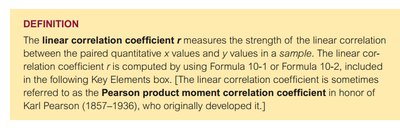
The linear correlation coefficient (denoted as r) measures the strength and direction of the linear relationship between paired quantitative variables in a sample. It is also known as the Pearson product-moment correlation coefficient.
Notation and Calculation
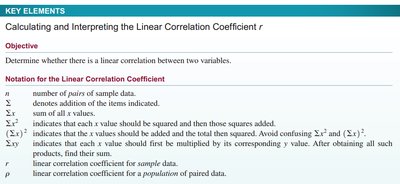
To determine whether a linear correlation exists between two variables, we use the following notations:
n: Number of pairs of sample data
Σx, Σy: Sums of x and y values, respectively
Σx², Σy²: Sums of squared x and y values
Σxy: Sum of the products of paired x and y values
r: Linear correlation coefficient for a sample
ρ (rho): Linear correlation coefficient for a population
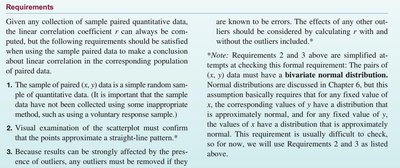
Requirements for Using r
Before calculating and interpreting r, certain requirements must be met:
The sample of paired (x, y) data must be a simple random sample of quantitative data.
A visual examination of the scatterplot must confirm that the points approximate a straight-line pattern.
Outliers must be removed if they are known errors, as r is sensitive to outliers.
The paired data should have a bivariate normal distribution (for formal inference).
Formula for Calculating r
The formula for the linear correlation coefficient r is:
$ r = \frac{n(\sum xy) - (\sum x)(\sum y)}{\sqrt{n(\sum x^2) - (\sum x)^2} \sqrt{n(\sum y^2) - (\sum y)^2}} $
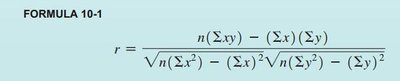
Note: In practice, statistical software is often used for calculations.
Properties of the Linear Correlation Coefficient r
The value of r is always between -1 and 1, inclusive ($-1 \leq r \leq 1$).
r does not change if all values of either variable are converted to a different scale.
r is not affected by the choice of x or y; interchanging x and y does not change r.
r measures only the strength of a linear relationship, not nonlinear relationships.
r is very sensitive to outliers; a single outlier can dramatically affect its value.
Examples: Matching Scatterplots to Correlation Coefficients
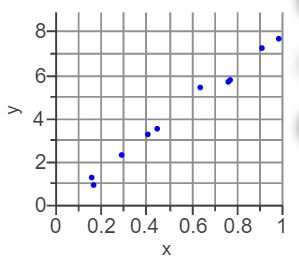
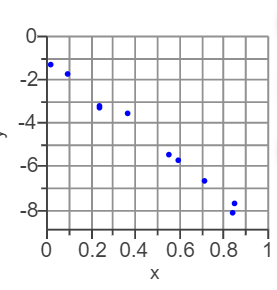
Below are examples of scatterplots with different correlation coefficients. Match each plot to the appropriate value of r:
r = -0.90: Strong negative linear correlation
r = 1.00: Perfect positive linear correlation
r = -0.33: Weak negative linear correlation
r = 0.90: Strong positive linear correlation
Interpreting r: Explained Variation and Causation
Explained Variation (r²)
If there is a linear correlation between x and y, we can use a linear equation to predict y from x. The value of r² (the coefficient of determination) represents the proportion of the variation in y that is explained by the linear relationship with x.
r² ranges from 0 to 1 (or 0% to 100%).
When r² is close to 1, most of the variation in y is explained by the linear relationship.
When r² is close to 0, most of the variation in y is not explained by the linear relationship.
Correlation Does Not Imply Causation
Even if a strong linear correlation is found, it does not mean that changes in one variable cause changes in the other. Other variables (called lurking variables) may influence the observed association.
Lurking Variables: Variables not included in the study that may affect the variables being analyzed.
Example: A correlation between chocolate consumption and Nobel Laureates does not mean eating chocolate causes Nobel Prizes; other factors may be involved.
Common Errors Involving Correlation
Assuming correlation implies causality.
Using data based on averages, which can inflate r by suppressing individual variation.
Ignoring the possibility of a nonlinear relationship.
Summary Table: Types of Correlation
Type of Correlation | Description | Value of r |
|---|---|---|
Perfect Positive | All points lie exactly on a straight line with positive slope | r = 1 |
Strong Positive | Points closely follow a straight line with positive slope | r close to 1 |
No Correlation | No discernible pattern | r ≈ 0 |
Strong Negative | Points closely follow a straight line with negative slope | r close to -1 |
Perfect Negative | All points lie exactly on a straight line with negative slope | r = -1 |
Additional info: The calculation and interpretation of r are foundational for further topics such as regression analysis, hypothesis testing for correlation, and analysis of variance.
