Back
BackCorrelation, Causation, and Linear Regression in Statistics
Study Guide - Smart Notes
 Tailored notes based on your materials, expanded with key definitions, examples, and context.
Q1. If we find that there is a linear correlation between the concentration of carbon dioxide (CO2) in our atmosphere and the global mean temperature, does that indicate that changes in CO2 cause changes in the global mean temperature? Why or why not?
Background
Topic: Correlation vs. Causation
This question tests your understanding of the difference between statistical correlation and causation. It asks you to consider whether a linear relationship between two variables implies that one variable causes changes in the other.
Key Terms:
Correlation: A statistical measure that describes the strength and direction of a relationship between two variables.
Causation: The idea that one variable directly affects another.
Spurious Correlation: A relationship where two variables appear to be related, but the association is due to coincidence or a third variable.
Step-by-Step Guidance
Recall that correlation measures the degree to which two variables move together, but it does not imply that one variable causes the other to change.
Think about possible confounding variables or external factors that could influence both CO2 concentration and global mean temperature.
Consider whether there is evidence from scientific studies or experiments that support a causal relationship, rather than just a statistical association.
Reflect on the difference between observational data (which can show correlation) and experimental data (which can help establish causation).
Try solving on your own before revealing the answer!
Q2. Cheese and Engineering: Is there sufficient evidence to conclude that there is a linear correlation between per capita consumption of mozzarella cheese and the number of civil engineering PhD degrees awarded? Do the results suggest that cheese consumption causes people to earn PhD degrees in civil engineering?
Background
Topic: Correlation, Causation, and Spurious Relationships
This question tests your ability to analyze whether a statistical relationship between two variables implies causation, and to recognize the possibility of spurious correlations.
Key Terms:
Linear Correlation: A relationship where the change in one variable is associated with a proportional change in another variable.
Spurious Correlation: A misleading association between two variables that is not due to any causal relationship.
Statistical Evidence: Data that supports or refutes the existence of a relationship between variables.
Step-by-Step Guidance
Examine the data for both cheese consumption and civil engineering PhDs to see if there is a pattern or trend.
Consider calculating the linear correlation coefficient (r) to quantify the strength of the relationship.
Think about whether there is any logical or scientific reason to believe that cheese consumption could cause people to earn PhDs in civil engineering.
Reflect on the possibility that the observed correlation is spurious, and consider other factors that could explain the association.
Try solving on your own before revealing the answer!
Q3. Notation: Using the regression equation , where x represents weight, answer the following:
a. What does the symbol x represent?
b. What are the specific values of the slope and y-intercept of the regression line?
c. What is the predictor variable?
d. Assuming a significant linear correlation, what is the best predicted value of highway fuel consumption for a car that weighs 3000 lb?
Background
Topic: Linear Regression and Interpretation
This question tests your understanding of regression equations, including the meaning of slope, y-intercept, predictor variables, and how to use the equation for prediction.
Key Terms and Formulas:
Regression Equation:
Slope (): The change in the predicted value of y for each unit increase in x.
Y-intercept (): The predicted value of y when x = 0.
Predictor Variable: The independent variable (x) used to predict the dependent variable (y).
Step-by-Step Guidance
Identify what x represents in the context of the regression equation (e.g., car weight).
Extract the values of the slope and y-intercept from the equation.
Determine which variable is being used to predict the other (predictor vs. response).
Set up the calculation for predicting y when x = 3000 lb, but do not compute the final value yet.
Try solving on your own before revealing the answer!
Q4. Cars: Find the best predicted value of highway fuel consumption for a small car that weighs 2500 lb using the regression equation .
Background
Topic: Linear Regression Prediction
This question tests your ability to use a regression equation to predict the value of a response variable given a specific value of the predictor variable.
Key Formula:
Where:
= predicted highway fuel consumption
= y-intercept (53.7)
= slope (-0.00505)
= car weight (2500 lb)
Step-by-Step Guidance
Write the regression equation: .
Substitute x = 2500 lb into the equation.
Set up the calculation for , but do not compute the final value yet.
Try solving on your own before revealing the answer!
Q5. Bear Measurements: Find the best predicted weight of a bear given that the bear has a head width of 6.5 in using the regression equation .
Background
Topic: Linear Regression Prediction
This question tests your ability to use a regression equation to predict the value of a response variable given a specific value of the predictor variable.
Key Formula:
Where:
= predicted weight
= y-intercept (-212)
= slope (61.9)
= head width (6.5 in)
Step-by-Step Guidance
Write the regression equation: .
Substitute x = 6.5 in into the equation.
Set up the calculation for , but do not compute the final value yet.
Try solving on your own before revealing the answer!
Q6. ESP: What is the probability of answering a question correctly if there is a 20% chance?
Background
Topic: Basic Probability
This question tests your understanding of probability as a measure of how likely an event is to occur.
Key Terms:
Probability: The likelihood of an event occurring, expressed as a decimal or fraction.
Step-by-Step Guidance
Identify the probability of answering correctly (given as 20%).
Express this probability as a decimal.
Try solving on your own before revealing the answer!
Q7. Standard Tests: What is the probability of a wrong answer if a random guess is made on a multiple-choice question with 5 possible answers?
Background
Topic: Probability of Complementary Events
This question tests your ability to calculate the probability of an event and its complement.
Key Formula:
Step-by-Step Guidance
Calculate the probability of a correct answer (1 out of 5 choices).
Find the probability of a wrong answer by subtracting the probability of a correct answer from 1.
Try solving on your own before revealing the answer!
Q8. Birthday: If a day of the year (not a leap year) is randomly selected, what is the probability it is the author's birthday?
Background
Topic: Probability of a Single Event
This question tests your understanding of calculating the probability of a specific outcome among many equally likely outcomes.
Key Formula:
Step-by-Step Guidance
Identify the total number of possible outcomes (days in a year).
Set up the calculation for the probability of selecting the author's birthday.
Try solving on your own before revealing the answer!
Q9. Online Courses: If two undergraduate students are randomly selected, what is the probability that they both take online courses only?
Background
Topic: Probability of Independent Events
This question tests your understanding of how to calculate the probability of two independent events both occurring.
Key Formula:
Step-by-Step Guidance
Identify the probability that one student takes online courses only (given as 10%).
Multiply the probability for the first student by the probability for the second student.
Try solving on your own before revealing the answer!
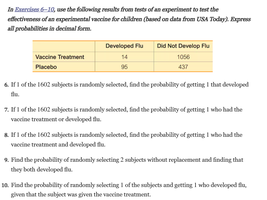
Q10. Vaccine Treatment: Use the table to find the probability of getting 1 who developed flu if 1 of the 1602 subjects is randomly selected.
Background
Topic: Probability from a Contingency Table
This question tests your ability to use a contingency table to calculate probabilities based on observed frequencies.
Key Formula:
Step-by-Step Guidance
Find the total number of subjects who developed flu (sum from both groups).
Divide by the total number of subjects (1602).
Try solving on your own before revealing the answer!
Q11. Left Handedness: Find the probability of randomly selecting a female who writes with her left hand.
Background
Topic: Joint Probability
This question tests your ability to calculate the probability of two events occurring together using a contingency table.
Key Formula:
Step-by-Step Guidance
Identify the number of females who write with their left hand from the table.
Divide by the total number of subjects.
Try solving on your own before revealing the answer!
Q12. Bear Weight and Chest Size: Is there sufficient evidence to support the claim that there is a linear correlation between the weights of bears and their chest sizes?
Background
Topic: Hypothesis Testing for Correlation
This question tests your ability to interpret correlation coefficients, critical values, and p-values to determine whether a linear relationship exists between two variables.
Key Terms and Formulas:
Correlation Coefficient (r): Measures the strength and direction of a linear relationship.
Critical Value: The threshold value for r to be considered statistically significant.
P-value: The probability of observing the data if the null hypothesis is true.
Step-by-Step Guidance
Compare the calculated correlation coefficient to the critical value.
Check the p-value to determine statistical significance.
Consider whether the evidence supports a linear relationship between the variables.
Try solving on your own before revealing the answer!
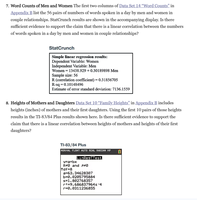
Q13. Word Counts of Men and Women: Is there sufficient evidence to support the claim that there is a linear correlation between the numbers of words spoken in a day by men and women in couples?
Background
Topic: Linear Correlation and Hypothesis Testing
This question tests your ability to interpret statistical output and determine whether a linear relationship exists between two variables.
Key Terms:
Correlation Coefficient (r): Measures the strength and direction of a linear relationship.
P-value: Used to assess statistical significance.
Step-by-Step Guidance
Review the statistical output for the correlation coefficient and p-value.
Compare the p-value to the significance level to determine if the correlation is statistically significant.
Consider whether the evidence supports a linear relationship between the word counts of men and women.
Try solving on your own before revealing the answer!
Q14. Heights of Mothers and Daughters: Is there sufficient evidence to support the claim that there is a linear correlation between heights of mothers and heights of their first daughters?
Background
Topic: Linear Correlation and Hypothesis Testing
This question tests your ability to interpret statistical output and determine whether a linear relationship exists between two variables.
Key Terms:
Correlation Coefficient (r): Measures the strength and direction of a linear relationship.
P-value: Used to assess statistical significance.
Step-by-Step Guidance
Review the statistical output for the correlation coefficient and p-value.
Compare the p-value to the significance level to determine if the correlation is statistically significant.
Consider whether the evidence supports a linear relationship between the heights of mothers and daughters.
Try solving on your own before revealing the answer!
Q15. Pearson's Formula: Calculate the r value using Pearson’s Formula.
Background
Topic: Pearson Correlation Coefficient Calculation
This question tests your ability to use the formula for the Pearson correlation coefficient to quantify the strength and direction of a linear relationship between two variables.
Key Formula:
Step-by-Step Guidance
Identify the values for n, , , , , and from the data.
Plug these values into the formula for r.
Set up the calculation for the numerator and denominator, but do not compute the final value yet.
Try solving on your own before revealing the answer!