 Back
BackCorrelation, Causation, and Linear Regression in Statistics
Study Guide - Smart Notes
 Tailored notes based on your materials, expanded with key definitions, examples, and context.
Q1. If we find that there is a linear correlation between the concentration of carbon dioxide (CO2) in our atmosphere and the global mean temperature, does that indicate that changes in CO2 cause changes in the global mean temperature? Why or why not?
Background
Topic: Correlation vs. Causation
This question tests your understanding of the difference between statistical correlation and causation. It asks you to consider whether a linear relationship between two variables implies that one variable causes changes in the other.
Key Terms:
Correlation: A statistical measure that describes the strength and direction of a relationship between two variables.
Causation: The idea that one variable directly affects another.
Spurious Correlation: When two variables appear to be related, but the relationship is actually due to coincidence or a third variable.
Step-by-Step Guidance
Recall that correlation measures the degree to which two variables move together, but it does not imply that one variable causes the other to change.
Think about possible confounding variables or external factors that could influence both CO2 concentration and global mean temperature.
Consider whether there is scientific evidence or theoretical reasoning that supports a causal relationship, beyond just statistical correlation.
Reflect on the difference between observational data and experimental data when making causal claims.
Try solving on your own before revealing the answer!
Final Answer:
No, finding a linear correlation does not necessarily mean that changes in CO2 cause changes in global mean temperature. Correlation does not imply causation; there may be other factors involved, or the relationship could be coincidental. To establish causation, further evidence such as controlled experiments or theoretical mechanisms is needed.
Q2. Listed below are annual data for various years. The data are weights (pounds) of per capita consumption of mozzarella cheese and the numbers of civil engineering PhD degrees awarded. Is there sufficient evidence to conclude that there is a linear correlation between the two variables? Do the results suggest that consumption of mozzarella cheese causes people to earn PhD degrees in civil engineering?
Background
Topic: Correlation, Spurious Relationships, and Causation
This question tests your ability to analyze whether a statistical relationship between two variables is meaningful or spurious, and whether correlation implies causation.
Key Terms:
Linear Correlation: A relationship where the change in one variable is associated with a proportional change in another.
Spurious Correlation: A misleading relationship between two variables that is not due to any direct connection.
Causation: One variable directly affects another.
Step-by-Step Guidance
Examine the data for both variables and consider whether there is a pattern that suggests a linear relationship.
Calculate the linear correlation coefficient (r) to quantify the strength and direction of the relationship.
Think about whether there is any logical or scientific reason to believe that cheese consumption could cause people to earn PhDs in civil engineering.
Reflect on the possibility of a spurious correlation, where the relationship is coincidental or due to a third variable.
Try solving on your own before revealing the answer!
Final Answer:
While there may be a statistical correlation between cheese consumption and civil engineering PhDs, this does not mean that cheese consumption causes people to earn PhDs. The relationship is likely spurious, and there is no logical causal connection between the two variables.
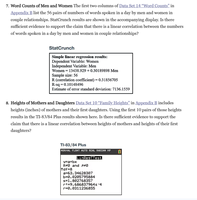
Q3. Using the weights (lb) and highway fuel consumption amounts (mi/gal) of 48 cars, we get this regression equation: , where x represents weight.
a. What does the symbol x represent?
b. What are the specific values of the slope and y-intercept of the regression line?
c. What is the predictor variable?
d. Assuming that there is a significant linear correlation between weight and highway fuel consumption, what is the best predicted value of highway fuel consumption of a car that weighs 3000 lb?
Background
Topic: Linear Regression and Prediction
This question tests your understanding of regression equations, interpretation of slope and intercept, and prediction using a regression model.
Key Terms and Formulas:
Regression Equation:
Slope (): The change in the response variable for each unit increase in the predictor variable.
Y-intercept (): The predicted value of the response variable when the predictor variable is zero.
Predictor Variable: The independent variable (x) used to predict the response variable (y).
Step-by-Step Guidance
Identify what x represents in the context of the regression equation.
Extract the values of the slope and y-intercept from the equation .
Determine which variable is the predictor (independent) variable.
Set up the calculation for the predicted value of y when x = 3000 lb, but do not compute the final value yet.
Try solving on your own before revealing the answer!
Final Answer:
a. x represents the weight of the car in pounds. b. The slope is -0.00749 and the y-intercept is 58.9. c. The predictor variable is weight. d. The predicted value is .
Q4. For the 12 small cars, the regression equation is . Find the best predicted value of the highway fuel consumption for a small car that weighs 2500 lb.
Background
Topic: Linear Regression Prediction
This question tests your ability to use a regression equation to predict the value of a response variable given a specific value of the predictor variable.
Key Formula:
Step-by-Step Guidance
Identify the values for the slope () and y-intercept () in the regression equation.
Set up the calculation for the predicted value of y when x = 2500 lb using the regression equation.
Try solving on your own before revealing the answer!
Final Answer:
The predicted value is .
Q5. Head widths (in) and weights (lb) were measured for 20 randomly selected bears. The regression equation is . Find the best predicted weight of a bear given that the bear has a head width of 6.5 in.
Background
Topic: Linear Regression Prediction
This question tests your ability to use a regression equation to predict the value of a response variable given a specific value of the predictor variable.
Key Formula:
Step-by-Step Guidance
Identify the values for the slope () and y-intercept () in the regression equation.
Set up the calculation for the predicted value of y when x = 6.5 in using the regression equation.
Try solving on your own before revealing the answer!
Final Answer:
The predicted weight is .
Q6. A psychologist tells you that in an ESP (extrasensory perception) experiment, there is a 20% chance of answering a question correctly. What is the probability of answering a question correctly?
Background
Topic: Probability
This question tests your understanding of basic probability concepts and how to interpret probability values.
Key Terms:
Probability: The likelihood of an event occurring, expressed as a decimal or fraction.
Step-by-Step Guidance
Recall that probability is the ratio of favorable outcomes to total possible outcomes.
Express the probability as a decimal or fraction as appropriate.
Try solving on your own before revealing the answer!
Final Answer:
The probability of answering a question correctly is 0.20.
Q7. Standard tests, such as the SAT or ACT or MCAT, tend to make extensive use of multiple-choice questions. If one such multiple-choice question has possible correct answers a, b, c, d, e, what is the probability of a wrong answer if the answer is a random guess?
Background
Topic: Probability of Complementary Events
This question tests your ability to calculate the probability of an event and its complement.
Key Formula:
Step-by-Step Guidance
Determine the probability of selecting the correct answer by random guess.
Calculate the probability of a wrong answer as the complement of the probability of a correct answer.
Try solving on your own before revealing the answer!
Final Answer:
The probability of a wrong answer is .
Q8. If a day of a year (not a leap year) is randomly selected, what is the probability it is the author's birthday?
Background
Topic: Probability of a Single Event
This question tests your ability to calculate the probability of a specific event occurring out of a set of equally likely outcomes.
Key Formula:
Step-by-Step Guidance
Identify the total number of possible outcomes (days in a year).
Calculate the probability of selecting the author's birthday as one specific day out of 365.
Try solving on your own before revealing the answer!
Final Answer:
The probability is .
Q9. Based on data from a survey, 10% of undergraduate students take online courses only. If two undergraduate students are randomly selected, what is the probability that they both take online courses only?
Background
Topic: Probability of Independent Events
This question tests your ability to calculate the probability of two independent events both occurring.
Key Formula:
Step-by-Step Guidance
Identify the probability that one student takes online courses only (0.10).
Multiply the probability for two independent selections: .
Try solving on your own before revealing the answer!
Final Answer:
The probability is .
