 Back
BackCorrelation, Causation, Regression, and Probability – Guided Study Notes
Study Guide - Smart Notes
 Tailored notes based on your materials, expanded with key definitions, examples, and context.
Q1. Does a linear correlation between CO₂ concentration and global mean temperature indicate causation?
Background
Topic: Correlation vs. Causation
This question tests your understanding of the difference between statistical correlation and causation. In statistics, finding a correlation between two variables does not necessarily mean that one causes the other.
Key Terms:
Correlation: A statistical measure that describes the strength and direction of a relationship between two variables.
Causation: When one variable directly affects another.
Confounding Variable: A third variable that may affect both variables being studied, possibly creating a spurious association.
Step-by-Step Guidance
Recall that correlation measures the association between two variables, but does not imply that one causes the other.
Think about possible confounding variables or other explanations for the observed correlation.
Consider what additional evidence would be needed to establish causation (e.g., experimental data, ruling out confounders).
Reflect on why it is important to distinguish between correlation and causation in scientific studies.
Try solving on your own before revealing the answer!
Q2. Cheese and Engineering: Is there a linear correlation between mozzarella cheese consumption and civil engineering PhDs? Does this suggest causation?
Background
Topic: Correlation, Spurious Correlation, and Causation
This question asks you to analyze a data set for correlation and to interpret whether a relationship implies causation, especially when the variables seem unrelated.
Key Terms and Formulas:
Linear Correlation Coefficient (r): Measures the strength and direction of a linear relationship between two variables.
Spurious Correlation: A correlation between two variables that is not due to any direct relationship but rather to coincidence or a third variable.
Step-by-Step Guidance
Examine the data for a pattern that suggests a linear relationship between cheese consumption and PhDs awarded.
Calculate or estimate the correlation coefficient using the data provided.
Interpret the value of to determine if there is a strong, weak, or no linear correlation.
Discuss whether the observed correlation makes logical sense or could be due to coincidence (spurious correlation).
Consider whether it is reasonable to conclude that cheese consumption causes more PhDs in civil engineering, or if another explanation is more likely.
Try solving on your own before revealing the answer!
Q3. Regression Equation Interpretation (Car Data)
Background
Topic: Simple Linear Regression
This question tests your ability to interpret a regression equation, identify variables, and use the equation for prediction.
Key Terms and Formulas:
Regression Equation:
Slope (): The change in for a one-unit increase in .
Intercept (): The predicted value of when .
Predictor Variable: The independent variable ().
Response Variable: The dependent variable ().
Step-by-Step Guidance
Identify what represents in the context of the regression equation provided.
State the values of the slope and intercept from the equation .
Determine which variable is the predictor (independent) and which is the response (dependent).
Set up the calculation for the predicted value of highway fuel consumption for a car that weighs 3000 lb by substituting into the regression equation.
Try solving on your own before revealing the answer!
Q4. Regression Prediction for Small Cars
Background
Topic: Regression Prediction
This question asks you to use a regression equation to predict the value of the response variable for a given value of the predictor variable.
Key Terms and Formulas:
Regression Equation:
Prediction: Substitute the given value of into the regression equation to estimate .
Step-by-Step Guidance
Identify the regression equation provided: .
Recognize that is the weight of the car and is the predicted highway fuel consumption.
Substitute into the regression equation to set up the calculation for the predicted value.
Try solving on your own before revealing the answer!
Q5. Bear Measurements: Predicting Weight from Head Width
Background
Topic: Regression Prediction
This question involves using a regression equation to predict the weight of a bear based on its head width.
Key Terms and Formulas:
Regression Equation:
Prediction: Substitute the given value of (head width) into the regression equation to estimate (weight).
Step-by-Step Guidance
Identify the regression equation: .
Recognize that is the head width and is the predicted weight.
Substitute into the regression equation to set up the calculation for the predicted weight.
Try solving on your own before revealing the answer!
Q6. Probability: ESP Experiment
Background
Topic: Basic Probability
This question tests your understanding of probability as a measure of the likelihood of an event occurring.
Key Terms and Formulas:
Probability:
Step-by-Step Guidance
Identify the probability of answering a question correctly as given (20%).
Express this probability as a decimal or fraction as needed.
Try solving on your own before revealing the answer!
Q7. Probability: Standard Test Guessing
Background
Topic: Probability of Complementary Events
This question asks you to find the probability of a wrong answer when guessing on a multiple-choice question.
Key Terms and Formulas:
Probability of Correct Answer:
Probability of Wrong Answer:
Step-by-Step Guidance
Determine the number of possible answers (e.g., a, b, c, d, e = 5 choices).
Calculate the probability of a correct answer by random guess.
Subtract the probability of a correct answer from 1 to find the probability of a wrong answer.
Try solving on your own before revealing the answer!
Q8. Probability: Birthday Problem
Background
Topic: Probability of a Specific Outcome
This question asks you to calculate the probability that a randomly selected day is the author's birthday.
Key Terms and Formulas:
Probability:
Step-by-Step Guidance
Recall that there are 365 days in a non-leap year.
Set up the probability as the chance of selecting one specific day out of 365.
Try solving on your own before revealing the answer!
Q9. Probability: Online Courses
Background
Topic: Probability of Independent Events
This question tests your understanding of the probability that two independent events both occur.
Key Terms and Formulas:
Probability of Both Events: (if independent)
Step-by-Step Guidance
Identify the probability that one student takes only online courses (10% or 0.10).
Multiply the probability for two independent students to find the probability that both take only online courses.
Try solving on your own before revealing the answer!
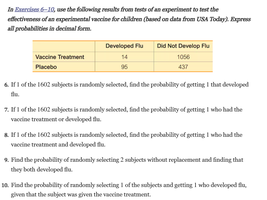
Q10. Probability with Vaccine Treatment Table
Background
Topic: Probability with Contingency Tables
This question involves calculating probabilities from a two-way table summarizing experimental results.
Key Terms and Formulas:
Probability:
Conditional Probability:
Step-by-Step Guidance
Identify the total number of subjects and the counts for each category in the table.
For each question, determine the number of favorable outcomes (e.g., developed flu, had vaccine, etc.).
Set up the probability as a fraction using the counts from the table.
Try solving on your own before revealing the answer!
Q11. Probability with Left-Handedness Table
Background
Topic: Probability with Contingency Tables
This question asks you to calculate various probabilities using a table that summarizes left-handedness by gender.
Key Terms and Formulas:
Probability:
Probability with Replacement: For independent selections, multiply probabilities.
Probability without Replacement: Adjust the denominator for each selection.
Complement:
Step-by-Step Guidance
Identify the total number of subjects and the counts for each category in the table.
For each question, determine the number of favorable outcomes (e.g., female, left-handed, etc.).
Set up the probability as a fraction using the counts from the table.
For questions involving two selections, consider whether selections are with or without replacement.
Try solving on your own before revealing the answer!
Q12. Bear Weight and Chest Size: Correlation and Prediction
Background
Topic: Correlation and Regression
This question asks you to interpret correlation results and consider the practical implications for prediction.
Key Terms and Formulas:
Correlation Coefficient (): Measures the strength and direction of a linear relationship.
P-value: Used to test the significance of the correlation.
Critical Value: The threshold for determining statistical significance.
Step-by-Step Guidance
Compare the correlation coefficient to the critical value to determine if the correlation is statistically significant.
Interpret the P-value in the context of the significance level ().
Discuss whether chest size can be used to predict weight based on the strength of the correlation.
Try solving on your own before revealing the answer!
Q13. Word Counts and Heights: Correlation Analysis
Background
Topic: Correlation and Regression Analysis
This question asks you to interpret output from statistical software and determine if there is a significant linear correlation between two variables.
Key Terms and Formulas:
Correlation Coefficient (): Indicates the strength and direction of a linear relationship.
P-value: Used to test the significance of the correlation.
Regression Equation: Used for prediction if a significant correlation exists.
Step-by-Step Guidance
Review the output for the correlation coefficient and P-value.
Compare the P-value to the significance level () to determine if the correlation is significant.
Interpret the results in the context of the variables (e.g., word counts, heights).
Try solving on your own before revealing the answer!
Q14. Calculating the Linear Correlation Coefficient (r)
Background
Topic: Calculating Pearson's Correlation Coefficient
This question asks you to use the formula for the linear correlation coefficient to measure the strength and direction of a linear relationship between two variables.
Key Formula:
Step-by-Step Guidance
List all the and values from your data set.
Calculate , , , , and .
Plug these sums into the formula above.
Carefully compute the numerator and denominator separately before combining them.
Try solving on your own before revealing the answer!
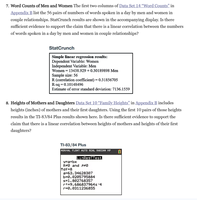
Q15. Powerball Jackpots and Tickets Sold: Correlation Analysis
Background
Topic: Scatterplots and Correlation
This question asks you to construct a scatterplot, calculate the correlation coefficient, and determine if there is a significant linear correlation between jackpot amounts and tickets sold.
Key Terms and Formulas:
Scatterplot: A graph of paired data points to visually assess the relationship.
Correlation Coefficient (): Use the formula provided above.
Critical Value: Compare to the critical value to assess significance.
Step-by-Step Guidance
Plot the paired data (jackpot, tickets sold) on a scatterplot to visually assess the relationship.
Calculate the correlation coefficient using the formula.
Find the critical value for at for your sample size.
Compare your calculated to the critical value to determine if the correlation is significant.
Try solving on your own before revealing the answer!
