 Back
BackCorrelation: Concepts, Calculation, and Interpretation
Study Guide - Smart Notes
 Tailored notes based on your materials, expanded with key definitions, examples, and context.
Correlation
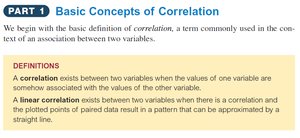
Basic Concepts of Correlation
Correlation is a statistical measure that describes the association between two variables. It is commonly used to determine whether and how strongly pairs of variables are related.
Correlation: Exists between two variables when the values of one variable are somehow associated with the values of the other variable.
Linear correlation: Exists when the association between two variables can be approximated by a straight line in a scatterplot of paired data.
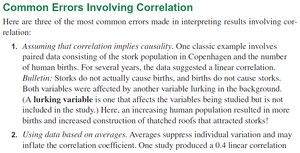
Common Errors Involving Correlation
When interpreting correlation results, it is important to avoid common mistakes:
Assuming correlation implies causality: Correlation does not mean that one variable causes the other. There may be a lurking variable affecting both.
Using data based on averages: Averages can suppress individual variation and inflate the correlation coefficient.
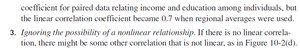
Ignoring the possibility of a nonlinear relationship: A lack of linear correlation does not rule out other types of association.
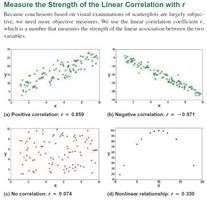
Measuring the Strength of Linear Correlation
The Linear Correlation Coefficient (r)
The linear correlation coefficient (denoted as r) measures the strength and direction of the linear relationship between paired quantitative variables. It is also known as the Pearson product moment correlation coefficient.
r > 0: Positive linear relationship
r < 0: Negative linear relationship
r = 0: No linear relationship

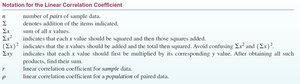
Notation for the Linear Correlation Coefficient
n: Number of pairs of sample data
Σ: Summation notation
x, y: Variables representing paired data
r: Linear correlation coefficient for sample data
ρ (rho): Linear correlation coefficient for a population
Requirements for Using r
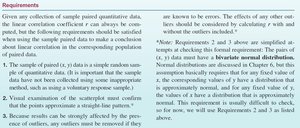
Before calculating the correlation coefficient, certain requirements must be met:
The sample of paired (x, y) data must be a simple random sample.
Visual examination of the scatterplot should confirm a roughly straight-line pattern.
Outliers should be removed if they are known errors.
Formulas for Calculating r
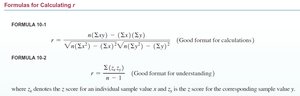
The correlation coefficient can be calculated using the following formulas:
Formula 10-1:
Formula 10-2:
Properties of the Linear Correlation Coefficient r
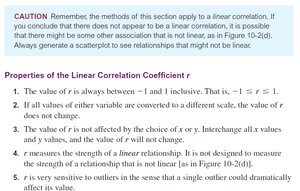
The value of r is always between -1 and 1:
Changing the scale of either variable does not affect r.
Interchanging x and y does not change r.
r measures the strength of a linear relationship only.
r is sensitive to outliers.
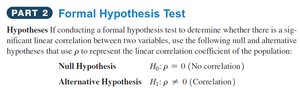
Formal Hypothesis Test for Correlation
Setting Up Hypotheses
To test for a significant linear correlation between two variables, set up the following hypotheses:
Null Hypothesis (H0): (No correlation)
Alternative Hypothesis (H1): (Correlation exists)
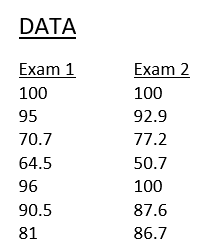
Example: Exam Scores
Consider the following paired data for Exam 1 and Exam 2 scores:
Exam 1 | Exam 2 |
|---|---|
100 | 100 |
95 | 92.9 |
70.7 | 77.2 |
64.5 | 50.7 |
96 | 100 |
90.5 | 87.6 |
81 | 86.7 |
The correlation results are as follows:
Sample Size (n) | Degrees of Freedom | Correlation Coefficient (r) | Critical r | P-Value (two-tailed) |
|---|---|---|---|---|
7 | 5 | 0.92146 | ±0.75449 | 0.00318 |
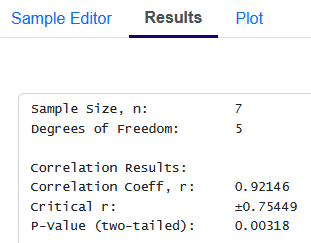
Interpretation: Since |r| > critical r and the p-value is less than 0.05, we reject the null hypothesis and conclude there is a significant positive correlation between Exam 1 and Exam 2 scores.
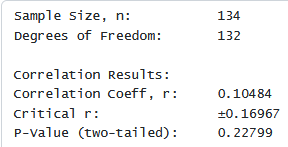
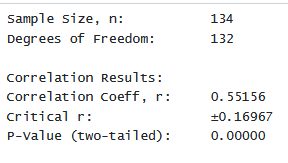
Example: Family Heights
Correlation analysis can also be applied to other data sets, such as family heights or car data. The process involves calculating r, comparing it to the critical value, and interpreting the p-value.
Sample Size (n) | Degrees of Freedom | Correlation Coefficient (r) | Critical r | P-Value (two-tailed) |
|---|---|---|---|---|
134 | 132 | 0.10484 | ±0.16967 | 0.22799 |
134 | 132 | 0.55156 | ±0.16967 | 0.00000 |
21 | 19 | -0.81195 | ±0.43286 | 0.00001 |
21 | 19 | 0.35132 | ±0.43286 | 0.11837 |
Worked Example: Chocolate Consumption and Nobel Laureates
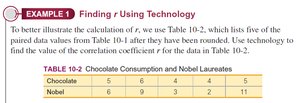
To illustrate the calculation of r, consider the following paired data:
Chocolate | Nobel |
|---|---|
5 | 6 |
6 | 9 |
4 | 3 |
5 | 2 |
4 | 11 |
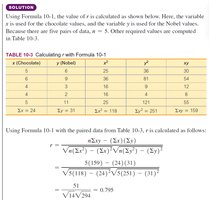
Using Formula 10-1, the calculation is as follows:
Interpretation: The calculated r value indicates the strength and direction of the linear relationship between chocolate consumption and Nobel laureates.
Cautions and Additional Notes
The methods discussed apply only to linear correlation. Always check for nonlinearity using a scatterplot.
Outliers can have a dramatic effect on the value of r.
Additional info: In practice, statistical software or calculators are often used to compute r and perform hypothesis tests for correlation.
