 Back
BackData Classification and Levels of Measurement in Statistics
Study Guide - Smart Notes
 Tailored notes based on your materials, expanded with key definitions, examples, and context.
Section 1.2: Data Classification
Variables in Statistics
In statistics, a variable is any characteristic or property observed in a study. Variables are the features of the subjects or individuals in a population, and they are what researchers measure or record. Variables are classified into two main types: qualitative and quantitative.
Qualitative Variables: These variables categorize individuals or subjects into distinct groups based on attributes or characteristics. Examples include gender, religious affiliation, or type of residence. Qualitative variables are also known as categorical variables and consist of non-numerical entries.
Quantitative Variables: These variables take numerical values that represent different magnitudes. Operations such as addition or averaging are meaningful for quantitative variables. Examples include age, number of siblings, or annual income.
Example Classification:
Gender: Qualitative
Temperature: Quantitative
Number of days studied: Quantitative
Zip code: Qualitative
Religious Affiliation: Qualitative
Age: Quantitative
Type of Residence: Qualitative
Belief in Life After Death: Qualitative
Number of Siblings: Quantitative
Annual Income: Quantitative
Key Features:
Quantitative variables: Focus on center and spread of data (e.g., mean, variance).
Qualitative variables: Focus on distribution across categories (e.g., percentage in each category).
Levels of Measurement
Data can be classified according to four levels of measurement, which determine the types of statistical analyses that are appropriate. The levels are nominal, ordinal, interval, and ratio.
Nominal Level: Qualitative data only. Data are categorized using names, labels, or qualities. No mathematical computations can be made.
Ordinal Level: Qualitative or quantitative data. Data can be arranged in order or ranked, but differences between entries are not meaningful.
Interval Level: Quantitative data. Data can be ordered, and differences between entries are meaningful. Zero is a position on the scale, not an inherent zero.
Ratio Level: Quantitative data. Similar to interval level, but zero is an inherent zero (implies "none"). Ratios of values are meaningful.
Examples and Applications of Levels of Measurement
The following table summarizes the four levels of measurement, providing examples and describing meaningful calculations for each level:
Level of Measurement | Example of Data Set | Meaningful Calculation |
|---|---|---|
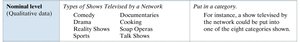
Nominal (Qualitative data) | Types of Shows Televised by a Network: Comedy, Drama, Reality Shows, Sports, Documentary, Cooking, Soap Opera, Talk Show | Put in a category. For instance, a show televised by the network could be put into one of the eight categories shown. |
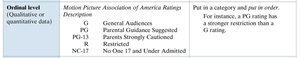
Ordinal (Qualitative or Quantitative data) | Motion Picture Association of America Ratings: G (General Audiences), PG (Parental Guidance Suggested), PG-13 (Parents Strongly Cautioned), R (Restricted), NC-17 (No One 17 and Under Admitted) | Put in a category and put in order. For instance, a PG rating has a stronger restriction than a G rating. |
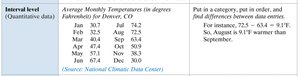
Interval (Quantitative data) | Average Monthly Temperatures (in degrees Fahrenheit) for Denver, CO: Jan 30.7, Feb 32.5, Mar 40.4, Apr 48.4, May 57.1, Jun 67.4, Jul 74.2, Aug 72.5, Sep 66.9, Oct 55.0, Nov 39.0, Dec 30.0 | Put in a category, put in order, and find differences between data entries. For instance, 72.5 - 64.4 = 8.1°F. So, August is 8.1°F warmer than September. |
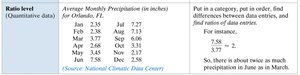
Ratio (Quantitative data) | Average Monthly Precipitation (in inches) for Orlando, FL: Jan 2.35, Feb 2.48, Mar 3.77, Apr 2.68, May 3.45, Jun 7.58, Jul 7.27, Aug 7.13, Sep 6.10, Oct 2.38, Nov 2.16, Dec 2.36 | Put in a category, put in order, find differences between data entries, and find ratios of data entries. For instance, , so there is about twice as much precipitation in June as in March. |
Summary of Levels of Measurement
The four levels of measurement provide a framework for understanding the nature of data and the types of statistical analyses that are appropriate. Nominal and ordinal levels are primarily used for qualitative data, while interval and ratio levels are used for quantitative data. The distinction between these levels is crucial for selecting proper statistical methods and interpreting results accurately.
