 Back
BackLesson 3.1
Study Guide - Smart Notes
 Tailored notes based on your materials, expanded with key definitions, examples, and context.
Chapter 2: Exploring Data with Graphs and Numerical Summaries
Section 2.1: Types of Data
This section introduces the foundational concepts of data types in statistics, focusing on how variables are classified and summarized. Understanding these distinctions is essential for proper data analysis and interpretation.
Individuals and Variables
Individuals: Objects described by a set of data. These may be people, animals, or things.
Variable: Any characteristic of an individual that can take different values for different individuals.
Examples: Age, height, weight, first language, color, etc.


Classification of Variables
Variables are classified into two main types: categorical and quantitative. This classification determines how data is analyzed and summarized.
Categorical Variables: Each observation belongs to one of a set of categories.
Quantitative Variables: Observations take numerical values representing different magnitudes.
Categorical Variable Examples
Sex (male or female)
Religious Affiliation (Catholic, Jewish, etc.)
Belief in Life after Death (Yes or No)
Type of residence (Apartment, Condo, etc.)
Quantitative Variable Examples
Age (years)
Number of siblings
Annual income


Main Features of Quantitative and Categorical Variables
Quantitative Variables: Key features are the center (such as mean or median) and spread (variability, such as range or standard deviation).
Categorical Variables: A key feature is the percentage of observations in each category.
Types of Quantitative Variables
Quantitative variables are further classified as discrete or continuous, based on the nature of their possible values.
Discrete Variables: Possible values form a set of separate numbers (e.g., 0, 1, 2, 3, ...). There is a finite number of possible values.
Continuous Variables: Possible values form an interval and there is an infinite number of possible values.
Discrete vs Continuous Examples
Continuous: Height, weight, age, blood pressure, etc.
Discrete: Number of pets, children, foreign languages spoken.
Proportion & Percentage (Relative Frequencies)
Proportions and percentages are used to summarize categorical data, showing the relative frequency of each category.
Proportion: The frequency (count) of observations in a category divided by the total number of observations.
Percentage: The proportion multiplied by 100.
Relative Frequency: Another term for proportion or percentage.
Formula:
Proportion:
Percentage:
Example
If 4 students received an "A" out of 40 students:
Frequency = 4
Proportion =
Percentage =
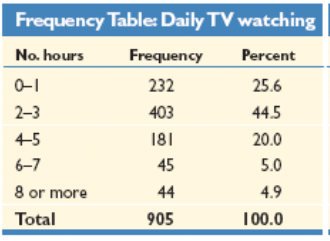
Frequency Table
A frequency table lists possible values for a variable, together with the number of observations and/or relative frequencies for each value. It is a fundamental tool for summarizing data.
No. hours | Frequency | Percent |
|---|---|---|
0–1 | 232 | 25.6 |
2–3 | 403 | 44.5 |
4–5 | 181 | 20.0 |
6–7 | 45 | 5.0 |
8 or more | 44 | 4.9 |
Total | 905 | 100.0 |
Lesson Summary
Descriptive statistics is the summarization of data using graphical and numerical methods.
Categorical variable: Observation belongs to a category.
Quantitative variable: Numerical value measuring magnitude of the observation.
