 Back
Describing and Summarizing Data: Categorical and Quantitative Variables
Study Guide - Smart Notes
 Tailored notes based on your materials, expanded with key definitions, examples, and context.
Describing and Summarizing Data
Overview
In statistics, the goal is to turn raw data into meaningful information. This module covers methods for summarizing and visualizing both categorical and quantitative data, including graphical displays, measures of center, and measures of spread.
Graphs and Tables for Categorical Data
Frequency Tables
Frequency tables summarize how many observations fall into each category of a categorical variable. For example, a frequency table for gender might show counts for male and female students.
Proportion: The count in a category divided by the total sample size.
Percentage: The proportion multiplied by 100%.
Relative Frequency Tables
Relative frequency tables show the fraction or percentage of observations in each category, allowing for comparison across groups of different sizes.
Bar Charts and Pie Charts
Bar Chart: Uses bars to show frequency or relative frequency. Bars are separated and suitable for comparing categories.
Pie Chart: Shows proportions as slices of a circle. Best for a small number of categories.
Contingency Tables
A contingency table (or two-way table) summarizes two categorical variables simultaneously, showing how they are related. Marginal totals and proportions can be calculated for rows and columns.
Marginal Proportion: Proportion out of the entire dataset.
Conditional Proportion: Proportion within a specific group.
Graphs for Quantitative Data
Describing Quantitative Data
For quantitative variables, describe the center, spread, shape, and outliers using graphs and summary statistics.
Center: Mean, median, mode
Spread: Standard deviation, range, interquartile range (IQR)
Shape: Symmetric, skewed right, skewed left, uniform
Outliers: Values that stand out from the rest
Shapes of Distributions
Symmetric: Mean and median are equal; data is evenly spread.
Skewed Right: Long tail to the right; mean > median.
Skewed Left: Long tail to the left; mean < median.
Uniform: All values equally likely.
Modality
Unimodal: One peak
Bimodal: Two peaks
Multimodal: More than two peaks
Histograms
A histogram displays the distribution of a quantitative variable using bars that touch each other, representing intervals (bins) of values.
Dotplots
Dotplots are useful for small datasets, showing each observation as a dot above a number line.
Boxplots
Boxplots (box-and-whisker plots) summarize the distribution using the five-number summary: minimum, Q1, median, Q3, maximum. Outliers are shown as dots outside the whiskers.
Measures of Center
Mean
The mean is the sum of all data values divided by the number of observations. It is sensitive to outliers.
Median
The median is the middle value when data is ordered. It is resistant to outliers.
Mode
The mode is the most frequent value in the dataset. There can be one mode (unimodal), two (bimodal), or more (multimodal).
Measures of Spread
Range
The range is the difference between the maximum and minimum values.
Range = Maximum - Minimum
Interquartile Range (IQR)
The IQR is the spread of the middle 50% of the data.
Standard Deviation
The standard deviation measures how far observations typically are from the mean.
Variance
Variance is the average squared deviation from the mean.
Choosing Measures Based on Distribution
For symmetric distributions: report mean and standard deviation.
For skewed distributions or with outliers: report median and IQR.
Shifting and Rescaling Data
Adding/subtracting a constant: changes measures of center, but not spread.
Multiplying/dividing by a constant: changes both center and spread by that constant.
Boxplots and Side-by-Side Comparisons
Boxplots for Comparing Groups
Side-by-side boxplots are used to compare a quantitative variable across categories of another variable. They allow comparison of center, spread, shape, and outliers between groups.
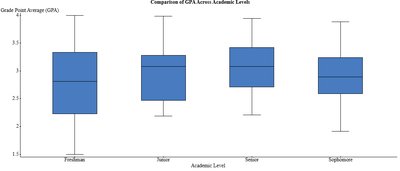
Example: The boxplot above compares GPA across academic levels (Freshman, Junior, Senior, Sophomore). It shows differences in median GPA, spread (IQR), and potential outliers between groups.
Z-Scores
Definition and Formula
A z-score tells how many standard deviations a data point is from the mean.
Positive z-score: value above the mean
Negative z-score: value below the mean
z = 0: value equals the mean
Applications of Z-Scores
Identify outliers (z > 3 or z < -3)
Standardize values for comparison across different scales
Compute probabilities
Empirical Rule (68-95-99.7 Rule)
For bell-shaped (normal) distributions:
68% of data within 1 standard deviation of the mean
95% within 2 standard deviations
99.7% within 3 standard deviations
Summary of Learning Outcomes
Summarize categorical data using tables and charts
Describe distribution shape, center, spread, and outliers
Calculate and interpret mean, median, mode, range, IQR, and SD
Choose appropriate measures based on distribution shape and outliers
Identify outliers and interpret boxplots
Use z-scores for comparison and outlier detection
Apply the Empirical Rule to normal distributions
