 Back
Describing and Summarizing Data: Central Tendency, Dispersion, and Graphical Methods
Study Guide - Smart Notes
 Tailored notes based on your materials, expanded with key definitions, examples, and context.
Statistical Foundations: Symbols, Parameters, and Statistics
Key Statistical Concepts and Notation
Understanding the distinction between population and sample, as well as the notation for common statistical measures, is fundamental in statistics. The following table summarizes the main symbols and their meanings:
Concept | Population Symbol | Sample Symbol |
|---|---|---|
Size / Total Units | N | n |
Arithmetic Mean | μ | 𝑥̅ |
Standard Deviation | σ | s (or Sx) |
Variance | σ2 | s2 (or Sx2) |
Summation Operator | ∑ | ∑ |
Observation / Value | xi | xi |
Class Frequency | fi | fi |
Parameter refers to a numerical summary of a population, while a statistic is a numerical summary of a sample.
Measures of Central Tendency
Mean (Arithmetic Average)
The mean is a measure of the center of a data set. It can be calculated for both populations and samples:
Population Mean:
Sample Mean:
Sample Mean from Grouped Data: , where are class midpoints.
Example: For grouped data with midpoints 15, 25, 35 and frequencies 4, 6, 2, the grouped mean is .
Measures of Dispersion (Variation)
Range, Variance, and Standard Deviation
Dispersion measures describe the spread of data values.
Range: Difference between the maximum and minimum values. Range = Maximum Data Value − Minimum Data Value
Population Variance:
Sample Variance:
Population Standard Deviation:
Sample Standard Deviation:
Example: For test scores 75, 82, 68, 91, 84, 79, 63, 88, 95, 72, the sample mean is 79.7 and the sample standard deviation is 10.3.
Describing Data with Tables and Graphs
Frequency Histograms
A frequency histogram is a graphical representation of the distribution of a dataset, showing the number of observations within each class interval. It helps visualize the shape, center, and spread of the data.
Class Width: Determined by subtracting consecutive lower class limits.
Shape: The histogram can reveal if the distribution is symmetric, skewed, or bell-shaped.
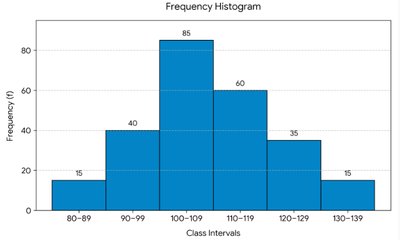
Example: In the histogram above, the distribution is bell-shaped and symmetric, with the highest frequency in the 100–109 interval.
Relative Frequency and Bar Charts
Relative frequency expresses the proportion of observations in each category. Bar charts are used to display the relative frequencies of categorical data.
Relative Frequency: , where is the frequency and is the total number of observations.
Bar Chart: Each bar represents a category, and its height corresponds to the relative frequency.
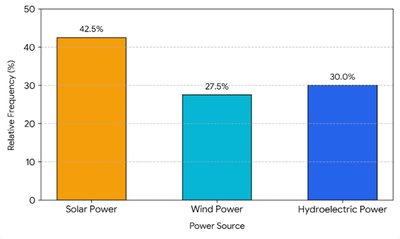
Example: In the bar chart above, 42.5% of respondents preferred solar power, 27.5% wind power, and 30.0% hydroelectric power.
Stem-and-Leaf Plots
Stem-and-leaf plots display quantitative data to retain the original values while showing the distribution. Each number is split into a "stem" (all but the final digit) and a "leaf" (the final digit).
Construction: List stems in order, then write each leaf next to its stem.
Interpretation: The plot shows the shape and spread of the data, and allows for reconstruction of the original dataset.
Example: For the data 12, 15, 20, 23, 27, 31, 34, 34, 38, 42, 46, the stem-and-leaf plot is: 1 | 2 5 2 | 0 3 7 3 | 1 4 4 8 4 | 2 6
Summary Statistics: Mode, Median, and Mean
Definitions and Calculations
Mode: The value(s) that appear most frequently in a dataset. If all values are unique, there is no mode.
Median: The middle value when data are ordered. For an even number of observations, the median is the average of the two middle values.
Mean: The arithmetic average, calculated as the sum of all values divided by the number of values.
Example: For the dataset 55.4, 70.5, 76.2, 80.1, 82.7, 88.3, 112.8, 118.0: - Mode: None - Median: (80.1 + 82.7)/2 = 81.4 - Mean: 683.9/8 = 85.5
Calculation Conventions and Summation
Midpoint Rule for Grouped Data
For grouped data, class midpoints are calculated using the lower limits of consecutive classes:
Midpoint Formula:
Example: For classes 10–19 and 20–29, midpoint = (10 + 20)/2 = 15.
Arithmetic Summation Expressions
Summation notation is used to represent the sum of a sequence of values. For example, calculates the average of the first, third, and fourth values in a list.
Example: If , , , , then .
