 Back
Describing and Summarizing Data in Introductory Statistics
Study Guide - Smart Notes
 Tailored notes based on your materials, expanded with key definitions, examples, and context.
Describing Data with Tables and Graphs
Ordered Arrays and Frequency Distributions
An ordered array is a sequence of data arranged from the smallest to the largest value. This arrangement helps to visualize the range of the data and can assist in identifying outliers. A frequency distribution is a summary table where data are grouped into intervals (classes), showing how many values fall into each interval. This condenses raw data into a more interpretable form and highlights where data are concentrated.
Number of intervals: Should be between 5 and 15. Use the formula:
Interval width:
Relative Frequency:
Percent:
Cumulative Frequency: Number of values in and below a particular category
Cumulative Percentage:
Choosing class boundaries carefully is important, as different boundaries can change the appearance of the distribution, especially for small datasets.
Describing Data Numerically
Measures of Central Tendency
Measures of central tendency describe the center of a data set. The three main measures are the mean, median, and mode.
Mean (Population): The arithmetic average of all values in the population.
The formula for the population mean is:
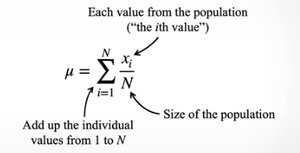
Mean (Sample): The arithmetic average of all values in the sample.
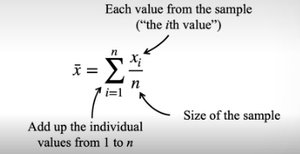
Median: The middle value when data are ordered. For an odd number of observations, it is the middle value; for an even number, it is the average of the two middle values.
Mode: The value that occurs most frequently in the data set. Useful for categorical, discrete, or binned continuous data.
Measures of Variability (Dispersion)
Measures of variability describe the spread of the data.
Range: Difference between the maximum and minimum values.
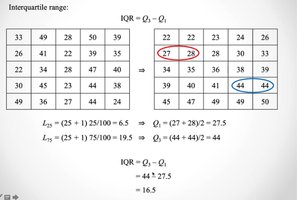
Interquartile Range (IQR): Difference between the 75th percentile (Q3) and the 25th percentile (Q1).
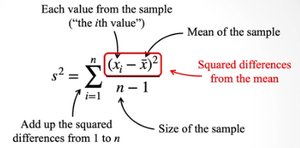
Variance: Average of the squared differences from the mean.
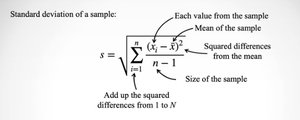
Standard Deviation: Square root of the variance; describes the average distance of values from the mean.
Population variance formula:
Sample variance formula:
Sample standard deviation formula:
Five Number Summary and Box Plots
The five number summary consists of the minimum, Q1, median (Q2), Q3, and maximum. A box plot graphically displays these values and highlights outliers.
Describing Data Graphically
Histograms and Distribution Shapes
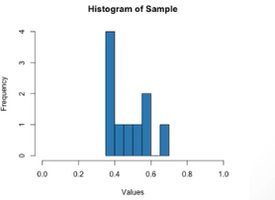
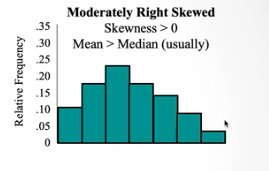
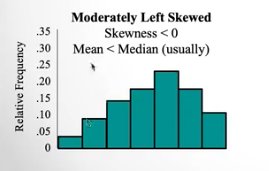
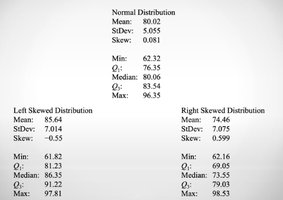
Histograms are used to visualize the distribution of data. The shape of the distribution can be symmetric, right-skewed, or left-skewed.
Symmetric (Not Skewed): Mean = Median; Skewness = 0
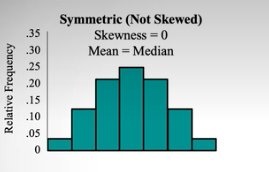
Moderately Right Skewed: Mean > Median; Skewness > 0
Moderately Left Skewed: Mean < Median; Skewness < 0
Measures of Distribution Shape
Skewness: Measures the asymmetry of the distribution around the mean.
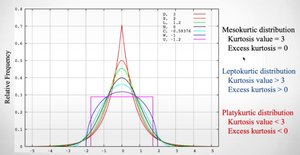
Kurtosis: Measures the "tailedness" of the distribution (how likely it is to have extreme values).
Probability Distributions
Types of Variables
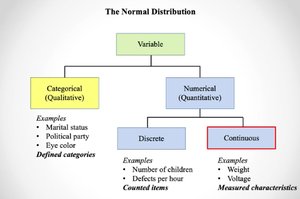
Variables can be classified as categorical (qualitative) or numerical (quantitative). Numerical variables can be discrete (counted) or continuous (measured).
Normal Distribution
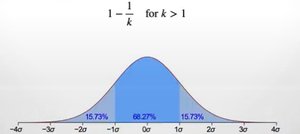
The normal distribution is a symmetric, bell-shaped curve defined by its mean () and standard deviation (). It is fundamental in inferential statistics.
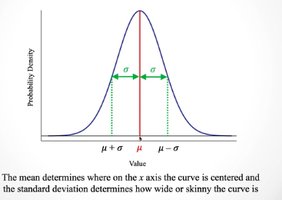
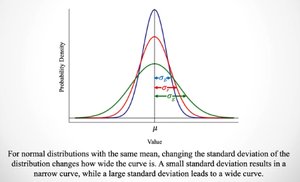
Changing the standard deviation alters the width of the curve, while the mean shifts its center.
The empirical rule states that for a normal distribution:
68% of data falls within 1 standard deviation of the mean
95% within 2 standard deviations
99.7% within 3 standard deviations
Sampling Distributions and the Central Limit Theorem
Sampling Distributions
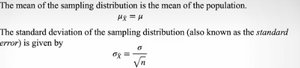
A sampling distribution is the probability distribution of a statistic (like the mean or proportion) based on all possible samples from a population. The mean of the sampling distribution of the sample mean is equal to the population mean, and its standard deviation (standard error) is .
The Central Limit Theorem states that, for large enough sample sizes, the sampling distribution of the sample mean will be approximately normal, regardless of the population's distribution.
Calculating Z-scores for Sampling Distributions
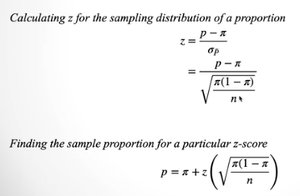
To standardize a sample mean or proportion, use the z-score formulas:
For means:
For proportions:
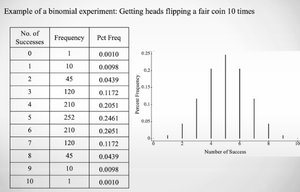
Binomial Distribution & Discrete Random Variables
Binomial Distribution
The binomial distribution models the number of successes in a fixed number of independent trials, each with the same probability of success (). The mean and standard deviation of a binomial random variable are:
Summary Table Example
The following table summarizes a probability distribution for the number of persons in a household:
Number of persons | Number of households (in millions) | Probability distribution | Cumulative probability |
|---|---|---|---|
1 | 31.1 | 0.2681 | 0.2681 |
2 | 38.6 | 0.3328 | 0.6009 |
3 | 18.8 | 0.1621 | 0.7629 |
4 | 16.2 | 0.1397 | 0.9026 |
5 | 7.2 | 0.0621 | 0.9647 |
6 | 2.7 | 0.0233 | 0.9879 |
7 or more | 1.4 | 0.0121 | 1.000 |
Evaluating Normality
To assess whether data are normally distributed, consider:
Visual inspection (histogram, Q-Q plot)
Descriptive statistics (mean ≈ median, skewness ≈ 0, kurtosis ≈ 3)
Empirical rule (proportion of data within 1, 2, 3 standard deviations)
Additional info:
These notes cover the foundational concepts of describing and summarizing data, probability distributions, and the basics of inferential statistics, as required for an introductory statistics course.
