Back
Describing and Summarizing Data: Shapes, Plots, and Graphical Integrity
Study Guide - Learn with Videos
 Curated lessons matched to your uploaded material – learn every topic step by step.
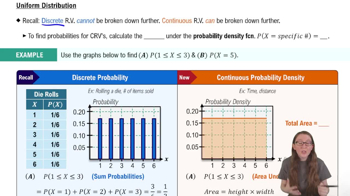
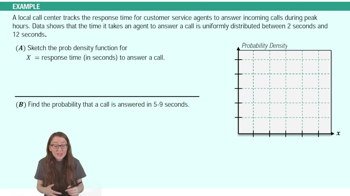
Uniform Distribution
- Guided course
 06:06

- Guided course 02:50
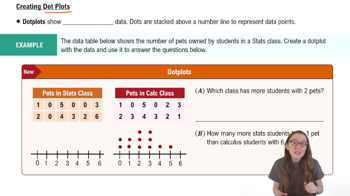
Dot Plots
- Guided course 04:01
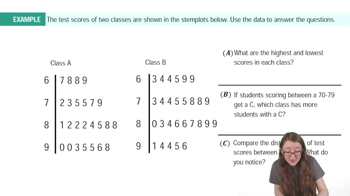
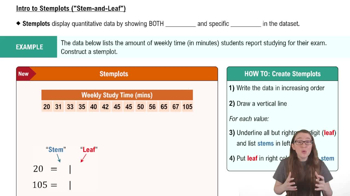
Stemplots (Stem-and-Leaf Plots)
- Guided course 06:09
- Guided course 06:23
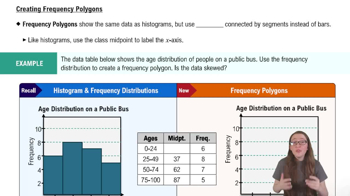
Frequency Polygons
- Guided course 04:41
- Guided course 04:15
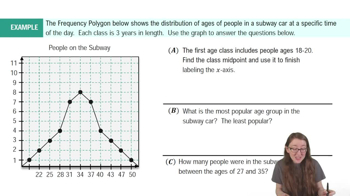
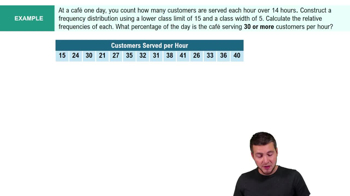
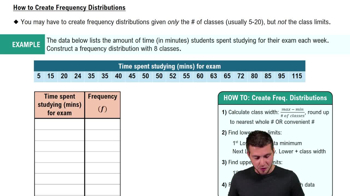
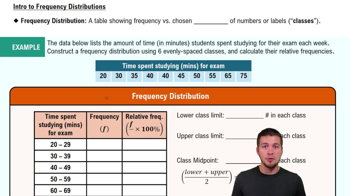
Frequency Distributions
- Guided course 06:19
- Guided course 06:29
- Guided course 06:38
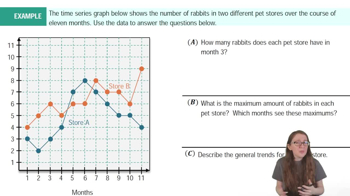
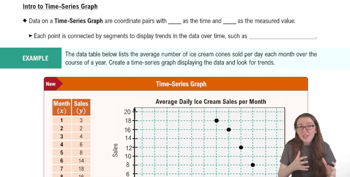
Time-Series Graph
- Guided course 04:36
- Guided course 04:13
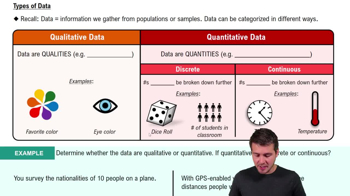
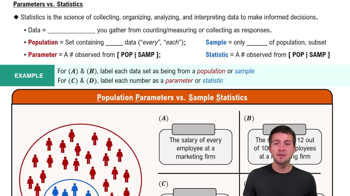
Intro to Stats
- Guided course 04:24
- Guided course 05:53
- Guided course 2:13

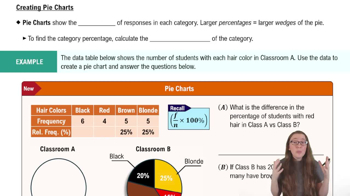
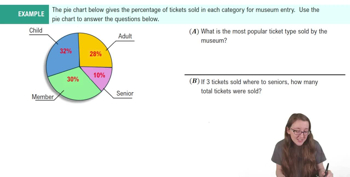
Pie Charts
- Guided course 06:10
- Guided course 01:18