Back
BackDescribing Data Numerically: Measures of Center and Spread
Study Guide - Smart Notes
 Tailored notes based on your materials, expanded with key definitions, examples, and context.
Describing Data Numerically
Measures of Center
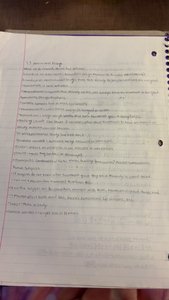
Measures of center are statistical tools used to summarize a set of data by identifying a central value around which the data are distributed. The most common measures of center are the mean, median, and mode.
Mean: The arithmetic average of a set of values. It is calculated by summing all values and dividing by the number of values.
Median: The middle value when the data are arranged in order. If the number of values is even, the median is the average of the two middle values.
Mode: The value that appears most frequently in the data set.
Example: For the data set {2, 4, 4, 5, 7}, the mean is 4.4, the median is 4, and the mode is 4.
Measures of Spread
Measures of spread describe how much the data values vary or disperse from the center. Common measures include range, variance, and standard deviation.
Range: The difference between the maximum and minimum values.
Variance: The average of the squared differences from the mean.
Standard Deviation: The square root of the variance, representing the average distance from the mean.
Example: For the data set {2, 4, 4, 5, 7}, the range is 5, variance is 2.24, and standard deviation is 1.5.
Comparing Measures of Center and Spread
Choosing the appropriate measure depends on the data's characteristics:
Mean is sensitive to outliers, while median is more robust.
Standard deviation and variance provide more information about variability than range.
Mode is useful for categorical data.
Applications
Measures of center and spread are used in summarizing data sets, comparing distributions, and identifying patterns in statistics.