 Back
Describing, Exploring, and Comparing Data: Measures of Relative Standing and Boxplots
Study Guide - Smart Notes
 Tailored notes based on your materials, expanded with key definitions, examples, and context.
Measures of Relative Standing and Boxplots
Introduction
This section explores statistical tools used to describe the position of individual data values within a data set. Key concepts include z scores, percentiles, quartiles, and the construction and interpretation of boxplots. These measures help compare values from different data sets and identify significant or unusual observations.
z Scores
Definition and Calculation
z Score: The number of standard deviations a data value (x) is above or below the mean.
For a sample:
For a population:
Round z scores to two decimal places.
Properties of z Scores
z scores are unitless.
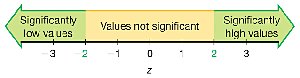
A z score less than or equal to −2 indicates a significantly low value.
A z score greater than or equal to +2 indicates a significantly high value.
Negative z scores indicate values below the mean.
Using z Scores to Identify Significant Values
Significantly low values:
Significantly high values:
Values not significant:
Example: Comparing Data Values
To compare values from different data sets, convert each to a z score.
Example: A body temperature of 99°F has a z score of 1.29; a quarter weighing 5.7790 g has a z score of 2.26. The quarter's weight is more extreme relative to its data set.
Example: Identifying Significant Earthquake Magnitude
Given: Mean = 2.572, Standard deviation = 0.651, Value = 4.01
z score:
Interpretation: Since 2.21 ≥ 2, the magnitude is significantly high.
Percentiles
Definition and Interpretation
Percentiles divide a data set into 100 groups, each containing about 1% of the values.
Notation: is the kth percentile (e.g., is the 25th percentile).
Finding the Percentile of a Data Value
Count the number of values less than the given value, divide by the total number of values, and multiply by 100. Round to the nearest whole number.
Example: If 36 out of 50 wait times are less than 45 minutes, then . Thus, 45 minutes is the 72nd percentile.
Converting a Percentile to a Data Value
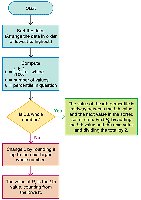
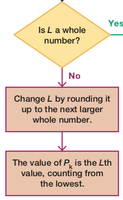
Calculate the locator (where is the percentile and is the number of values).
If is not a whole number, round up to the next whole number. The value at this position in the sorted data is the percentile value.
Quartiles
Definition and Description
Quartiles divide data into four groups, each containing about 25% of the values.
(first quartile): Same as ; separates the lowest 25% from the rest.
(second quartile): Same as and the median; separates the lowest 50% from the highest 50%.
(third quartile): Same as ; separates the lowest 75% from the highest 25%.
Note: There is not universal agreement on the exact procedure for calculating quartiles; results may vary by method or technology.
Statistics Defined Using Quartiles and Percentiles
Interquartile Range (IQR):
Semi-interquartile Range:
Midquartile:
10–90 Percentile Range:
5-Number Summary
Definition and Example
The 5-number summary consists of: Minimum, , Median (), , Maximum.
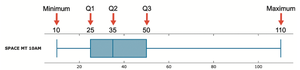
Example (Space Mountain wait times): 10, 25, 35, 50, 110 (all in minutes).
Boxplots (Box-and-Whisker Diagrams)
Definition and Construction
A boxplot is a graphical representation of the 5-number summary.
It consists of a box from to , a line at the median (), and "whiskers" extending to the minimum and maximum values.
Procedure for Constructing a Boxplot
Find the 5-number summary.
Draw a line from the minimum to the maximum value.
Draw a box from to with a line at the median.
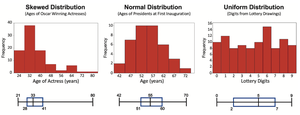
Skewness
Identifying Skewness with Boxplots
A distribution is skewed if it is not symmetric and extends more to one side.
Boxplots can help visually identify skewness in data distributions.
Identifying Outliers and Modified Boxplots
Procedure for Identifying Outliers
Find , , and .
Calculate .
Compute .
A value is an outlier if it is below or above .
Modified Boxplots
Modified boxplots use special symbols (e.g., asterisks) to mark outliers.
The whiskers extend only to the most extreme non-outlier values.
