 Back
Describing, Exploring, and Comparing Data: Measures of Relative Standing and Boxplots
Study Guide - Smart Notes
 Tailored notes based on your materials, expanded with key definitions, examples, and context.
Describing, Exploring, and Comparing Data
Measures of Relative Standing and Boxplots
This section introduces key statistical tools for understanding the position of individual data values within a data set. These include z scores, percentiles, quartiles, and graphical representations such as boxplots. These concepts help in comparing values from different data sets and identifying outliers or significant values.
z Scores
A z score (also called a standard score or standardized value) indicates how many standard deviations a data value (x) is above or below the mean. It allows for comparison across different data sets or distributions.
Formula for a sample:
Formula for a population:
Round-off rule: Round z scores to two decimal places (e.g., 2.31).
Interpretation:
z > 0: Value is above the mean.
z < 0: Value is below the mean.
z = 0: Value equals the mean.
Significance:
z ≤ −2: Significantly low value
z ≥ 2: Significantly high value
−2 < z < 2: Not significant
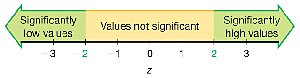
Example: If a body temperature of 99°F has a z score of 1.29 and a quarter weighing 5.7790 g has a z score of 2.26, the quarter's weight is more extreme relative to its data set because its z score is farther from the mean.
Application: To determine if an earthquake magnitude of 4.01 is significantly high, calculate its z score using the mean and standard deviation. If z ≥ 2, it is significantly high.
Percentiles
Percentiles divide a data set into 100 equal groups, each containing about 1% of the values. The kth percentile, Pk, is the value below which k% of the data fall.
Notation:
n: Total number of values
k: Percentile (e.g., for the 25th percentile, k = 25)
L: Locator (position in the sorted list)
Pk: kth percentile value
Finding the percentile of a data value: Count the number of values less than x, divide by n, and multiply by 100. Round to the nearest whole number.
Converting a percentile to a data value: Use the locator L = (k/100) × n. If L is not a whole number, round up to the next whole number; the value at this position is the percentile value.
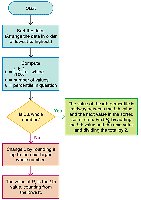
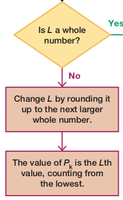
Example: In a sorted list of 50 wait times, the 25th percentile (P25) is the 13th value, which is 25 minutes. This means 25% of wait times are less than 25 minutes.
Quartiles
Quartiles divide a data set into four equal parts, each containing about 25% of the values:
Q1 (First quartile): Same as P25; separates the lowest 25% from the rest.
Q2 (Second quartile): Same as P50 and the median; separates the lowest 50% from the highest 50%.
Q3 (Third quartile): Same as P75; separates the lowest 75% from the highest 25%.
Note: There is not universal agreement on the exact procedure for calculating quartiles; different methods may yield slightly different results.
Statistics Defined Using Quartiles and Percentiles
Interquartile Range (IQR):
Semi-interquartile Range:
Midquartile:
10–90 Percentile Range:
5-Number Summary
The 5-number summary provides a concise description of a data set:
Minimum
First quartile (Q1)
Median (Q2)
Third quartile (Q3)
Maximum
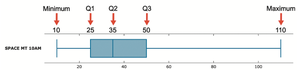
Example: For "Space Mountain" wait times: 10, 25, 35, 50, and 110 minutes.
Boxplot (Box-and-Whisker Diagram)
A boxplot is a graphical representation of the 5-number summary. It displays the distribution, center, and spread of the data, and helps identify outliers and skewness.
Line from minimum to maximum value
Box from Q1 to Q3 with a line at the median (Q2)
Skewness
Skewness refers to the asymmetry in the distribution of data. A boxplot can help identify whether a distribution is skewed (not symmetric) or symmetric.
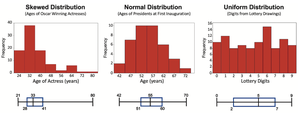
Skewed Distribution: Data extends more to one side.
Normal Distribution: Data is symmetric around the center.
Uniform Distribution: Data is evenly spread across the range.
Identifying Outliers for Modified Boxplots
Outliers are values that are unusually far from the rest of the data. In a modified boxplot:
Calculate IQR:
Compute 1.5 × IQR
A value is an outlier if it is: Above Q3 by more than 1.5 × IQR, or Below Q1 by more than 1.5 × IQR
Outliers are marked with a special symbol (e.g., asterisk or point), and the whiskers extend only to the most extreme non-outlier values.
Summary Table: Key Measures and Their Purposes
Measure | Purpose |
|---|---|
z Score | Standardizes values for comparison; identifies significant values |
Percentile | Describes relative standing within a data set |
Quartile | Divides data into four equal parts |
5-Number Summary | Summarizes distribution with five key values |
Boxplot | Visualizes distribution, spread, and outliers |
IQR | Measures spread of the middle 50% of data |
