 Back
BackDescribing Qualitative Data: Frequency, Relative Frequency, and Graphical Methods
Study Guide - Smart Notes
 Tailored notes based on your materials, expanded with key definitions, examples, and context.
Describing Qualitative Data
Qualitative Variables and Classes
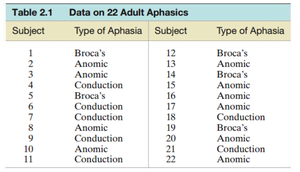
Qualitative data, also known as categorical data, are non-numerical and are classified into distinct categories called classes. Each observation in a qualitative variable falls into one of these classes. For example, in a study of aphasia, the variable "type of aphasia" is qualitative, with possible classes: Broca’s, conduction, and anomic.
Class: A category into which qualitative data can be classified.
Example: Types of aphasia (Broca’s, conduction, anomic) in adult patients.
Class Frequency, Relative Frequency, and Percentage
To summarize qualitative data, we use three main numerical measures: class frequency, class relative frequency, and class percentage. These measures help describe how often each category occurs in the data set.
Class Frequency: The number of observations in the data set that fall into a particular class.
Class Relative Frequency: The proportion of the total number of observations falling into each class.
Class Percentage: The class relative frequency multiplied by 100.
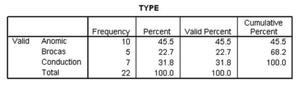
For the aphasia study, the class frequencies are: Anomic (10), Broca’s (5), Conduction (7). The relative frequencies and percentages are calculated accordingly.

Graphical Descriptive Methods for Qualitative Data
Graphical methods provide visual summaries of qualitative data, making it easier to compare categories and understand distributions. The main graphical methods are:
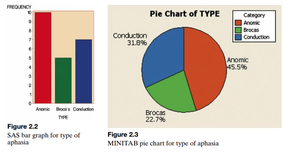
Bar Graph: Categories are represented by bars, with heights corresponding to frequency, relative frequency, or percentage.
Pie Chart: Categories are represented by slices of a pie, with sizes proportional to relative frequency.
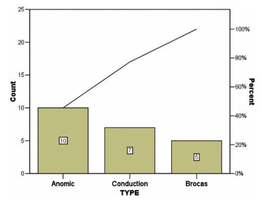
Pareto Diagram: A bar graph with categories arranged in descending order of frequency.
Application Example: Cardiac Drug Study
Qualitative Variables in Medical Research
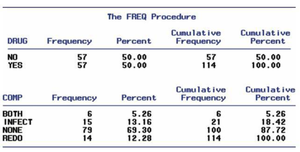
In medical studies, qualitative variables are often used to classify patients by treatment group or by type of complication. For example, in a study of a new drug for coronary bypass patients, the variables include whether the patient received the drug (DRUG: YES/NO) and the type of complication (COMP: BOTH, INFECT, NONE, REDO).
DRUG: Indicates if the patient received the drug (YES or NO).
COMP: Specifies the type of complication: redo surgery, post-op infection, both, or none.
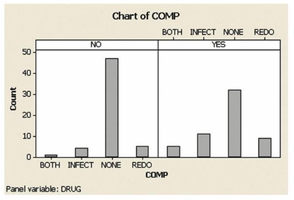
Graphical Representation of Complications by Drug Status
Bar charts can be used to compare the frequency of complications between patients who received the drug and those who did not. This allows researchers to visually assess the impact of the drug on complication rates.
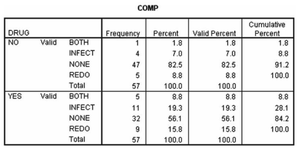
Contingency Tables for Qualitative Data
Contingency tables display the frequency and percentage of each category for two qualitative variables, allowing for comparison across groups. For example, the table below shows the distribution of complications for patients who did and did not receive the drug.
DRUG | COMP | Frequency | Percent | Valid Percent | Cumulative Percent |
|---|---|---|---|---|---|
NO | BOTH | 1 | 1.8 | 1.8 | 1.8 |
NO | INFECT | 4 | 7.0 | 7.0 | 8.8 |
NO | NONE | 47 | 82.5 | 82.5 | 91.2 |
NO | REDO | 5 | 8.8 | 8.8 | 100.0 |
YES | BOTH | 5 | 8.8 | 8.8 | 8.8 |
YES | INFECT | 11 | 19.3 | 19.3 | 28.1 |
YES | NONE | 32 | 56.1 | 56.1 | 84.2 |
YES | REDO | 9 | 15.8 | 15.8 | 100.0 |
Summary
Describing qualitative data involves classifying observations into categories, calculating frequencies and percentages, and using graphical methods for visualization. These techniques are essential for summarizing and interpreting categorical variables in statistics, especially in medical and social science research.
