 Back
Describing the Relation Between Two Variables: Scatter Diagrams, Correlation, and Least-Squares Regression
Study Guide - Smart Notes
 Tailored notes based on your materials, expanded with key definitions, examples, and context.
Chapter 4: Describing the Relation Between Two Variables
Section 4.1: Scatter Diagrams and Correlation
In statistics, understanding the relationship between two quantitative variables is essential for data analysis. This section introduces graphical and numerical methods for describing such relationships, focusing on scatter diagrams and the correlation coefficient.
Univariate vs. Bivariate Data
Univariate data: Data in which a single variable is measured for each individual.
Bivariate data: Data in which two variables are measured on each individual, allowing us to study the relationship between them.
We are often interested in how changes in one variable (the explanatory variable or independent variable) affect another variable (the response variable or dependent variable).
Explanatory variable: The variable we control or believe explains changes in the response variable.
Response variable: The variable that changes as a result of changes in the explanatory variable.
Example: A marketing firm studies the relationship between hours of television advertising (explanatory variable) and product sales (response variable).
Scatter Diagrams
A scatter diagram is a graphical tool used to display the relationship between two quantitative variables. Each point represents an individual’s values for both variables.
The response (dependent) variable is plotted on the y-axis.
The explanatory (independent) variable is plotted on the x-axis.
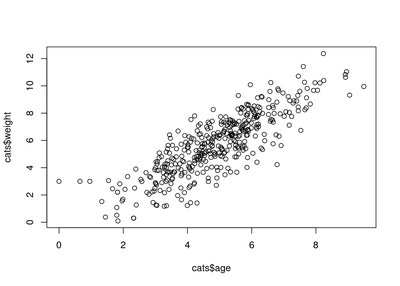
Scatter diagrams help us visually identify trends, such as linear or nonlinear patterns, and the direction (positive or negative) of the relationship.
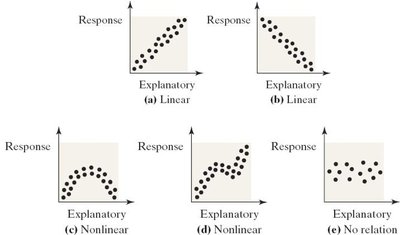
Interpreting Scatter Diagrams
Linear pattern: Points fall roughly along a straight line.
Curved (nonlinear) pattern: Points follow a curved path.
No pattern: Points are scattered randomly, indicating no relationship.
Positive relationship: As x increases, y increases (upward slope).
Negative relationship: As x increases, y decreases (downward slope).
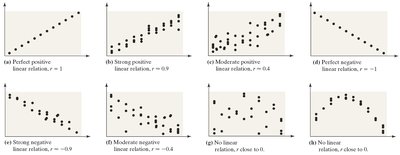
Correlation Coefficient (r)
The linear correlation coefficient (Pearson’s r) is a numerical measure of the strength and direction of the linear relationship between two quantitative variables.
Population correlation coefficient: (rho)
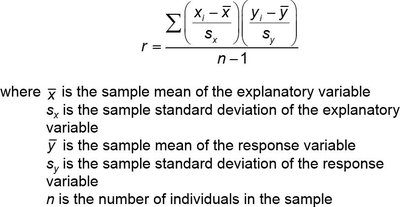
Sample correlation coefficient:
The formula for the sample correlation coefficient is:
Properties of the Correlation Coefficient
r is always between -1 and 1, inclusive.
r = 1: Perfect positive linear relationship.
r = -1: Perfect negative linear relationship.
r close to 0: Little or no linear relationship.
The closer r is to ±1, the stronger the linear relationship.
r is unitless and unaffected by the units of measurement.
r is sensitive to outliers, which can distort the value.
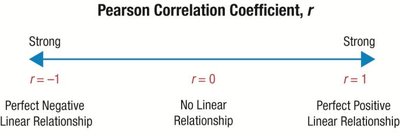
Examples of Correlation Strength and Direction
Calculating the Correlation Coefficient
Correlation can be calculated using statistical software or calculators. For example, using a TI-83/84 calculator or StatCrunch, you can input the data and use built-in functions to compute r.
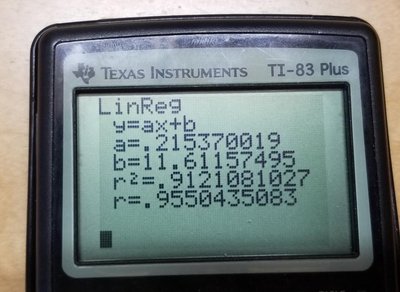
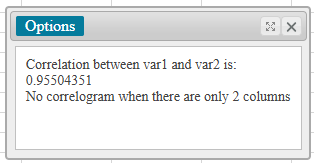
Testing for a Linear Relation
To determine if a linear relationship exists, compare the absolute value of r to a critical value from a table based on sample size (n). If |r| is greater than the critical value, a significant linear relationship exists.
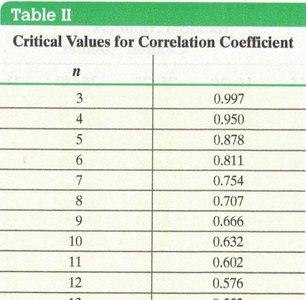
Correlation vs. Causation
Correlation does not imply causation. A high correlation between two variables does not mean that changes in one cause changes in the other. Correlation can be due to:
Coincidence
Lurking variables (third variables affecting both)
Trends in time series data
Example: A high correlation between cheese consumption and deaths by bedsheet entanglement does not imply causation.

Section 4.2: Least-Squares Regression
Once a linear relationship is established, we can model it with a linear equation using the method of least squares regression. This allows us to predict values and understand the relationship quantitatively.
Finding the Least-Squares Regression Line
The least-squares regression line is the line that minimizes the sum of the squared differences (residuals) between observed and predicted values of the response variable.
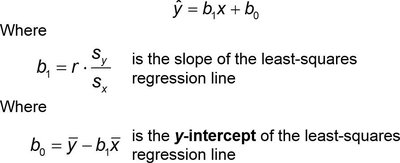
The equation of the least-squares regression line is:
is the slope:
is the y-intercept:
Calculating and Interpreting the Regression Line
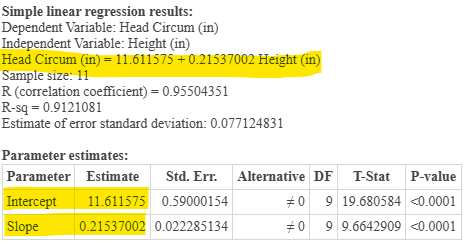
Given summary statistics and the correlation coefficient, you can compute the regression line. For example, with head circumference (y) and height (x) data:
Mean of x (): 26.455
Standard deviation of x (): 1.0944
Mean of y (): 17.309
Standard deviation of y (): 0.235
Correlation coefficient (r): 0.955
The regression equation is:
Interpreting Slope and Intercept
Slope: For each one-unit increase in the explanatory variable, the response variable increases by the value of the slope.
Intercept: The predicted value of the response variable when the explanatory variable is zero. Interpretation depends on whether zero is a meaningful value for the explanatory variable.
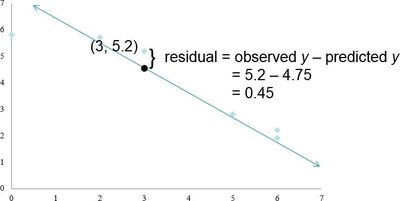
Residuals
A residual is the difference between the observed value and the predicted value from the regression line:
Using the Regression Line for Prediction
The regression line can be used to predict the response variable for values of the explanatory variable within the range of observed data. Predictions outside this range (extrapolation) are unreliable.
Summary Table: Steps for Least-Squares Regression
Step | Description |
|---|---|
1 | Calculate means and standard deviations for both variables |
2 | Compute the correlation coefficient (r) |
3 | Calculate the slope () and intercept () |
4 | Write the regression equation |
5 | Interpret the slope and intercept |
6 | Use the equation for prediction (within the scope of the data) |
Cautions in Regression Analysis
Do not use the regression line to predict values outside the observed range (extrapolation).
Check for outliers, as they can significantly affect the regression line.
Remember that correlation does not imply causation.
Key Terms and Concepts
Bivariate data
Explanatory variable
Response variable
Scatter diagram
Correlation coefficient (r)
Least-squares regression line
Residual
Lurking variable
Extrapolation
