 Back
Ch 4 part 2 Contingency Tables and Association
Study Guide - Smart Notes
 Tailored notes based on your materials, expanded with key definitions, examples, and context.
4.4 Contingency Tables and Association
Introduction
This section explores how to describe and analyze the relationship between two categorical variables using contingency tables. Key concepts include marginal and conditional distributions, association, and Simpson’s Paradox.
4.4.1 Compute the Marginal Distribution of a Variable
Marginal distribution refers to the frequency or relative frequency distribution of either the row or column variable in a contingency table. It summarizes the totals for each category of one variable, ignoring the other variable.
Contingency Table (Two-Way Table): Relates two categories of data. The row variable is typically the outcome or response, while the column variable is the explanatory variable. Each cell in the table represents a combination of categories.
Marginal Frequency: The total count for each category of a variable, found by summing across rows or columns.
Relative Frequency Marginal Distribution: The proportion of observations in each category, calculated by dividing the marginal frequency by the total number of observations.
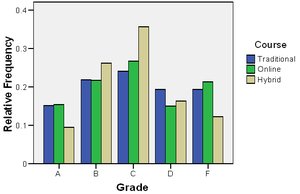
Example: A professor tallied grades (A, B, C, D, F) for students in three course delivery methods: traditional, online, and hybrid. Marginal distributions can be computed for both grades and delivery methods to summarize the data.
Additional info: Marginal distributions help identify overall patterns in one variable, regardless of the other variable.
4.4.2 Use the Conditional Distribution to Identify Association among Categorical Data
Conditional distribution lists the relative frequency of each category of the response variable, given a specific value of the explanatory variable. It is used to examine whether an association exists between two categorical variables.
Conditional Relative Frequency: Calculated by dividing the frequency in each cell by the total for the given category of the explanatory variable.
Association: If the conditional distributions differ across categories of the explanatory variable, there is evidence of an association between the variables.
Example: Constructing a conditional distribution of course grade by method of delivery reveals that students in the hybrid course are more likely to pass (A, B, or C) than those in traditional or online courses.
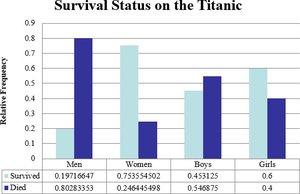
Example: The survival status of Titanic passengers by demographic group can be visualized using a conditional bar graph, showing differences in survival rates among men, women, boys, and girls.
Additional info: Conditional distributions are essential for detecting relationships and patterns that may not be visible in marginal distributions alone.
4.4.3 Explain Simpson’s Paradox
Simpson’s Paradox occurs when an association between two variables reverses or disappears upon introducing a third variable (a lurking variable). This paradox highlights the importance of considering all relevant variables in data analysis.
Lurking Variable: A variable not included in the analysis that can affect the observed relationship between the variables of interest.
Interpretation: Simpson’s Paradox demonstrates that aggregated data can be misleading if important subgroups are ignored.
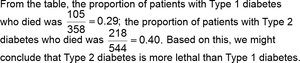
Example: In a study of diabetes patients, the overall data suggested that Type 2 diabetes was more lethal than Type 1. However, when patients were divided by age (≤40 and >40), the relationship reversed, showing the importance of age as a lurking variable.

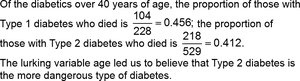
Additional info: Always consider potential lurking variables when interpreting associations in contingency tables to avoid misleading conclusions.
Key Terms and Formulas
Marginal Relative Frequency:
Conditional Relative Frequency:
Summary Table: Types of Distributions in Contingency Tables
Type of Distribution | Description | Purpose |
|---|---|---|
Marginal Distribution | Distribution of a single variable, ignoring the other | Summarize overall totals |
Conditional Distribution | Distribution of one variable for a fixed value of the other | Identify association between variables |
