 Back
BackDescribing the Relation Between Two Variables: Scatterplots and Correlation
Study Guide - Smart Notes
 Tailored notes based on your materials, expanded with key definitions, examples, and context.
Describing the Relation Between Two Variables
Introduction to Bivariate Data
In statistics, understanding the relationship between two variables is essential for data analysis. Bivariate data consists of pairs of linked numerical observations, and analyzing these pairs helps us uncover patterns, trends, and associations.
Bivariate Data: Data involving two variables measured on the same subjects.
Examples: Height and weight of individuals, temperature and ice cream sales, club-head speed and golf ball distance.
Scatterplots
A scatterplot is a graphical representation of bivariate data. Each point on the plot corresponds to a pair of values for the two variables. Scatterplots are fundamental tools for visualizing the type, direction, and strength of the relationship between variables.
Purpose of Scatterplots:
To visually assess the relationship between two quantitative variables.
To detect patterns, clusters, or outliers in the data.
To determine if a linear or nonlinear association exists.
Axes: The independent variable (predictor) is plotted on the x-axis, and the dependent variable (response) is plotted on the y-axis.

Linearity, Direction, and Strength
Scatterplots allow us to describe the relationship between variables in terms of linearity, direction, and strength.
Linearity
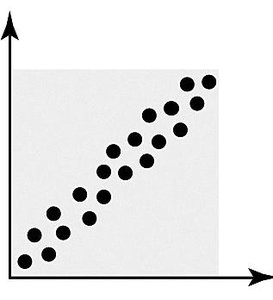
Linear Relationship: The points tend to cluster around a straight line.
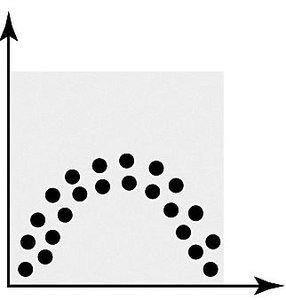
Nonlinear Relationship: The points follow a curved pattern.
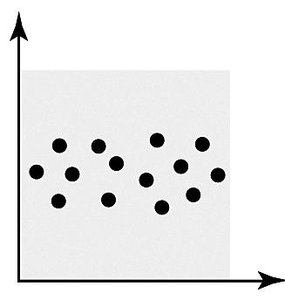
No Relationship: The points are scattered randomly with no discernible pattern.

Direction
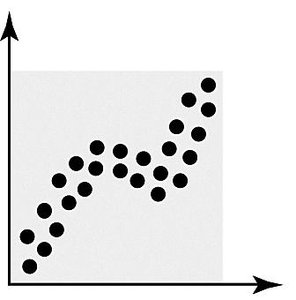
Positive Association: As one variable increases, the other tends to increase.
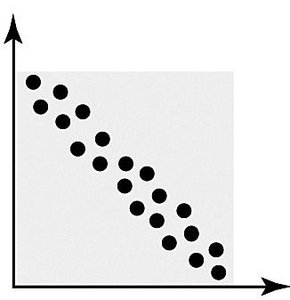
Negative Association: As one variable increases, the other tends to decrease.

Strength
Strong Relationship: Points are closely clustered around a line or curve.
Weak Relationship: Points are more widely scattered.
No Relationship: No apparent pattern.


The Linear Correlation Coefficient (r)
The linear correlation coefficient, denoted as r, is a numerical measure of the strength and direction of the linear relationship between two quantitative variables. The value of r ranges from -1 to +1.
Properties of r:
r = +1: Perfect positive linear relationship
r = -1: Perfect negative linear relationship
r = 0: No linear relationship
The closer |r| is to 1, the stronger the linear relationship.
r is unitless and unaffected by changes in scale or origin of the variables.

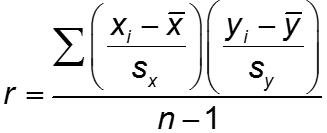
The formula for the sample correlation coefficient is:
Where and are the individual sample values, and are the sample means, and are the sample standard deviations, and is the sample size.
Interpreting the Value of r
The value of r indicates both the direction and the strength of the linear relationship:
r > 0: Positive association
r < 0: Negative association
|r| close to 1: Strong linear relationship
|r| close to 0: Weak or no linear relationship
Examples of Relations
Different scatterplots can illustrate various types of relationships:
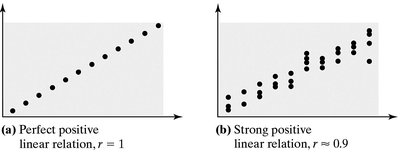
Perfect Positive Linear Relation: All points lie exactly on a straight line with positive slope (r = 1).
Strong Positive Linear Relation: Points are close to a straight line with positive slope (r ≈ 0.9).
Nonlinear Relation: Points follow a curved pattern; r may be close to 0 even if the relationship is strong but not linear.
No Relation: Points are scattered randomly; r ≈ 0.
Important Considerations
Correlation does not imply causation: A strong correlation between two variables does not mean that one causes the other.
Outliers: Extreme values can greatly affect the value of r and the appearance of the scatterplot.
Nonlinear Relationships: The correlation coefficient only measures linear relationships. Nonlinear associations may exist even if r ≈ 0.
Example: A dataset with a perfect quadratic relationship will have r ≈ 0, even though the variables are strongly related.
Additional info: For more on the limitations of correlation, see: https://en.wikipedia.org/wiki/Correlation_does_not_imply_causation
