 Back
Descriptive Measures in Statistics: Center, Variation, and Distribution Shape
Study Guide - Smart Notes
 Tailored notes based on your materials, expanded with key definitions, examples, and context.
Chapter 3: Descriptive Measures
3.1 Measures of Center
Measures of center, or measures of central tendency, indicate the central or most typical value in a data set. The three primary measures are the mean, median, and mode.
Mean: The arithmetic average of all data values. It is calculated by summing all values and dividing by the number of values.
Median: The middle value when the data are arranged in order. If the number of values is even, the median is the average of the two middle values.
Mode: The value that occurs most frequently in the data set. There can be more than one mode or no mode at all.
Example: For the data set 7, 3, 1, 2, 6, 4, 2, 7, 0, 3, 5, 9, 7:
Mean:
Median: Arrange data and find the middle value.
Mode: The value(s) that appear most often.
Choosing a Measure of Center: The appropriate measure depends on the context and the presence of outliers or skewness. For example, the median is preferred for skewed distributions or when outliers are present.
Resistant Measures: A measure is resistant if it is not affected much by extreme values (outliers). The mean is not resistant, while the median is resistant.
Population Mean vs. Sample Mean: The population mean is denoted by , and the sample mean by .
Summation Notation: For data values , the sum is written as .
Formula for Sample Mean:
Example: For data 77, 68, 93, 91, 97, write the sum using summation notation and calculate the mean.
3.2 Measures of Variation
Measures of variation, or spread, describe how much the data values differ from each other. Common measures include the range, interquartile range (IQR), and standard deviation.
Range: The difference between the maximum and minimum values.
Sample Standard Deviation (s): Measures the average distance of data values from the mean. It is not resistant to outliers.
Formula for Sample Standard Deviation (Computing Formula):
Defining Formula:
Key Fact: Larger standard deviation means more spread; smaller means less spread.
Three Standard Deviations Rule: Almost all observations in any data set lie within three standard deviations of the mean.
3.3 Chebyshev’s Rule and the Empirical Rule
These rules describe how data values are distributed relative to the mean and standard deviation.
Chebyshev’s Rule (for any data set):
At least 75% of data within 2 standard deviations of the mean.
At least 89% within 3 standard deviations.
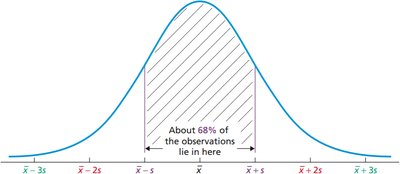
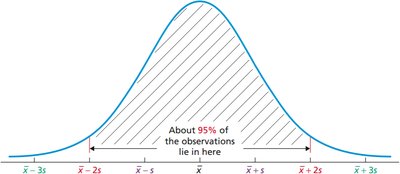
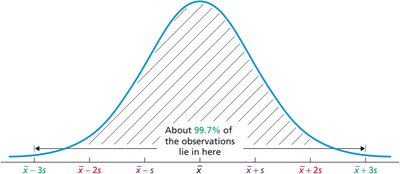
Empirical Rule (for bell-shaped distributions):
About 68% within 1 standard deviation.
About 95% within 2 standard deviations.
About 99.7% within 3 standard deviations.
3.4 The Five-Number Summary; Boxplots
The five-number summary provides a concise description of a data set:
Minimum
First Quartile ()
Median ()
Third Quartile ()
Maximum
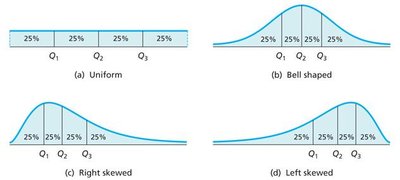
Quartiles: Divide the data into four equal parts. is the 25th percentile, (median) is the 50th percentile, and is the 75th percentile.
Interquartile Range (IQR):
Potential Outliers: Data values outside the range are considered potential outliers.
Boxplot: A graphical display of the five-number summary, showing the spread and skewness of the data, and highlighting potential outliers.
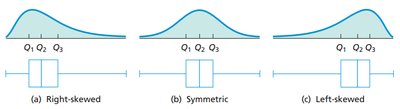
Comparing Boxplots: Boxplots can be used to compare the distribution shapes of different data sets (right-skewed, symmetric, left-skewed).
3.5 Descriptive Measures for Populations; Use of Samples
Descriptive measures can be calculated for both samples and populations.
Population Mean ():
Population Standard Deviation (): or
Parameter: A descriptive measure of a population.
Statistic: A descriptive measure of a sample.
Standardized Variable (z-score): For a value , the standardized value is . The z-score indicates how many standard deviations a value is from the mean.
Positive z-score: Value above the mean.
Negative z-score: Value below the mean.
z = 0: Value equals the mean.
Example: If , , and your score is 84, then .
Distribution Shape and Measures of Center
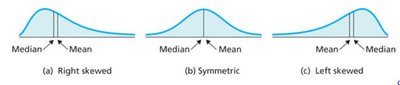
The relationship between the mean and median can indicate the shape of the distribution:
Right-skewed: Mean > Median
Symmetric: Mean ≈ Median
Left-skewed: Mean < Median
Quartiles and Distribution Shape
The positions of quartiles (, , ) can also indicate the shape of the distribution:
Additional info: The notes above include expanded explanations, formulas, and context for all major concepts in descriptive statistics, including measures of center, variation, the five-number summary, boxplots, and the use of z-scores for standardization and comparison.
