 Back
BackDescriptive Measures in Statistics: Mean, Median, Mode, and Standard Deviation
Study Guide - Smart Notes
 Tailored notes based on your materials, expanded with key definitions, examples, and context.
Descriptive Measures
Measures of Center: Mean
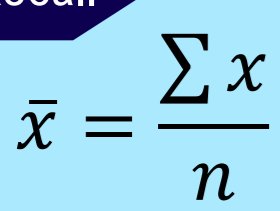
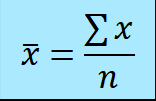
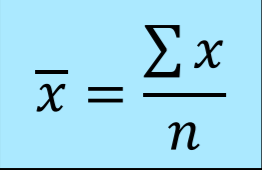
The mean is a fundamental measure of center in statistics, representing the average value of a dataset. It is calculated by summing all values and dividing by the total number of values. The mean provides a single, central value that summarizes the data.
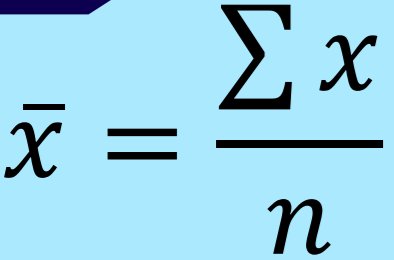
Definition: The mean is the sum of all data values divided by the number of values.
Formula:
Symbols: Population mean is denoted by , sample mean by , population size by , and sample size by .
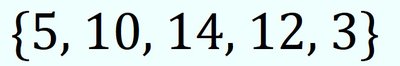
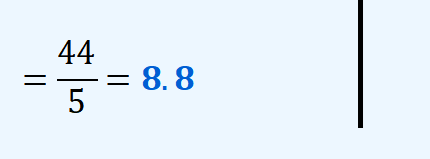
Example: For the data set {5, 10, 14, 12, 3}, the mean is .


Properties of the Mean
The mean uses all values in the dataset.
Extreme values (outliers) can significantly affect the mean.
Best used when data is symmetric and does not contain outliers.
Measures of Center: Median
The median is another measure of center, representing the middle value when the data is ordered. It is less affected by outliers and skewed data.
Definition: The median is the middle value in an ordered dataset. If the number of values is odd, it is the central value; if even, it is the average of the two central values.
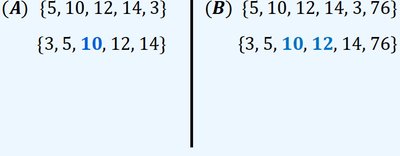
Example: For the data set {5, 10, 14, 12, 3}, ordered as {3, 5, 10, 12, 14}, the median is 10.
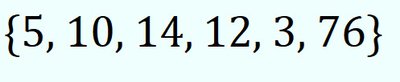
Example with outlier: For {5, 10, 14, 12, 3, 76}, ordered as {3, 5, 10, 12, 14, 76}, the median is (10+12)/2 = 11.
Properties of the Median
The median is resistant to outliers.
Best used when data is skewed or contains outliers.
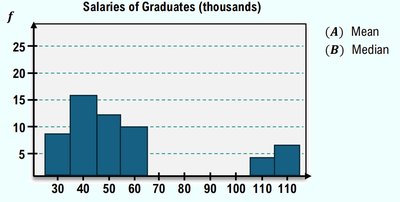
Mean vs. Median
Both mean and median are measures of center, but they have distinct advantages and disadvantages depending on the data distribution.
Mean: Uses all values, sensitive to outliers, best for symmetric data.
Median: Resistant to outliers, best for skewed data.
Measures of Center: Mode
The mode is the value that appears most frequently in a dataset. It can be used for both quantitative and qualitative data.
Definition: The mode is the most frequent value(s) in a dataset.
Classification:
Unimodal: One mode
Bimodal: Two modes
Multimodal: Three or more modes
Example: In the data set {0, 0, 2, 2, 3, 4, 1, 2, 2, 0, 4, 1, 3, 0}, the mode is 0 and 2 (bimodal).
Measures of Variation
Standard Deviation
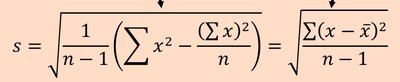
The standard deviation is a measure of variation that quantifies the spread of data values around the mean. It is essential for understanding the distribution of data.
Definition: Standard deviation measures how much the values in a dataset deviate from the mean.
Formula:
Properties:
Larger indicates more spread out data.
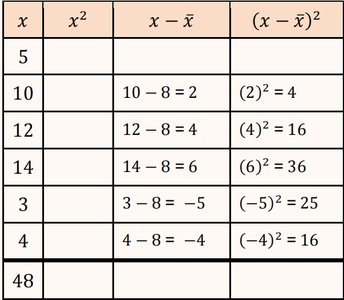
Example: For the data set {5, 10, 12, 14, 3, 4}, calculate each and sum, then divide by and take the square root.
Empirical Rule (68-95-99.7 Rule)
The Empirical Rule describes the percentage of data within 1, 2, or 3 standard deviations of the mean in a normal distribution.
Approximately 68% of data falls within 1 standard deviation.
Approximately 95% falls within 2 standard deviations.
Approximately 99.7% falls within 3 standard deviations.
Percentiles and Quartiles
Percentiles
A percentile indicates the percentage of values in a dataset below a particular value.
Formula:
Example: If a score of 1280 is higher than 7 out of 12 SAT scores, its percentile is .
Quartiles and Interquartile Range (IQR)
Quartiles:
Q1: 25th percentile
Q3: 75th percentile
Interquartile Range (IQR):
Example: For SAT scores, Q1 = 1195, Q3 = 1390, so IQR = 1390 - 1195 = 195.
Describing Data Numerically Using a Graphing Calculator
Five-Number Summary
The Five-Number Summary consists of the minimum, Q1, median, Q3, and maximum values. Calculators can quickly compute these for large datasets.
Example: For ages in a statistics class, use a calculator to find mean, median, standard deviation, Q1, and Q3.
Boxplots
Box and Whisker Plots
A boxplot visually displays the Five-Number Summary, showing the spread and center of the data.
Components: Minimum, Q1, Median, Q3, Maximum
Example: Construct a boxplot for SAT scores: Min = 1100, Q1 = 1195, Med = 1260, Q3 = 1390, Max = 1550.
Interpreting Boxplots
Boxplots allow comparison of distributions, medians, ranges, and quartiles between groups.
Example: Compare SAT scores of juniors and seniors using boxplots to determine which group has a higher median or greater range.
Additional info: These notes cover the main descriptive measures in statistics, including center, variation, and graphical representation, suitable for exam preparation in a college statistics course.
