 Back
BackDescriptive Statistics and Data Collection Methods in Health Sciences
Study Guide - Smart Notes
 Tailored notes based on your materials, expanded with key definitions, examples, and context.
Introduction to Statistics
Why Statistics Matter in Health Sciences
Statistics is essential for transforming health data into meaningful evidence. It enables researchers to test treatments, identify risk factors, and evaluate research outcomes with confidence. By mastering statistical methods, students gain critical thinking skills and the ability to make evidence-based decisions that improve health outcomes.
Populations and Samples
Definitions and Relationships
A population is the entire group of individuals of interest in a study, while a sample is a subset of the population selected for analysis. The goal is to use sample data to make inferences about the population.
Population: All individuals of interest (e.g., all students at a university).
Sample: Individuals selected to participate in the research study.
Inferential Statistics: Using sample data to draw conclusions about the population.
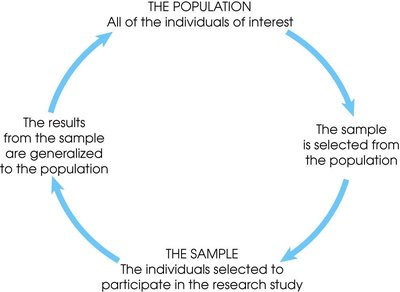
Example: Population vs. Sample
In a survey of 250 students at the University of Ottawa, 35 reported smoking regularly. The population is all students at the university, while the sample is the 250 surveyed students.
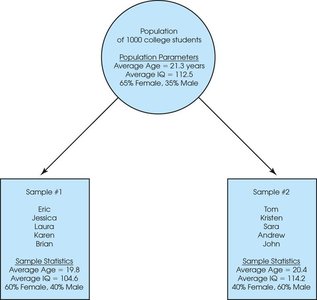
Parameters and Statistics
Key Definitions
Parameter: A numerical description of a population characteristic (e.g., average age of all students).
Statistic: A numerical description of a sample characteristic (e.g., average age of surveyed students).
Example
If a survey of 450 students reports an average weekly income of $325, this is a sample statistic.
If the average weekly income for all students is $405, this is a population parameter.
Sampling Error
Definition and Importance
Sampling error is the discrepancy between a sample statistic and its corresponding population parameter. It arises naturally due to chance and is a central concept in inferential statistics.
Sampling error quantifies the uncertainty in generalizing sample results to the population.
Measuring and minimizing sampling error is crucial for reliable statistical inference.
Methods of Sample Collection
Simple Random Sampling (SRS)
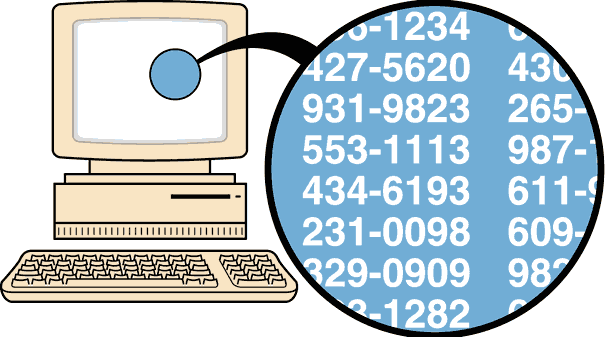
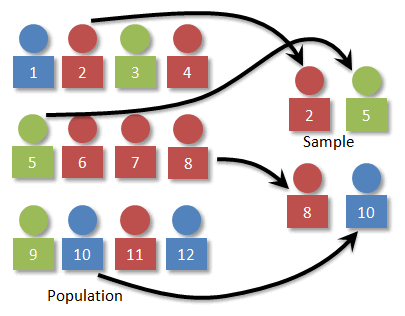
In SRS, every possible sample of size n from a population of size N has an equally likely chance of being selected. This method ensures unbiased representation.
Random number generators or tables are often used to select samples.
Systematic Sampling
Systematic sampling involves selecting a starting point and then choosing every kth element in the population.
Example: Selecting every 3rd person from a list.

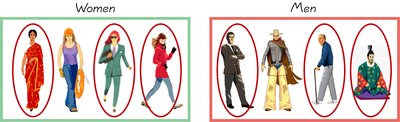
Stratified Sampling
Stratified sampling divides the population into subgroups (strata) that share specific characteristics, then samples are drawn from each subgroup.
Ensures representation of all subgroups (e.g., gender, age).
Cluster Sampling
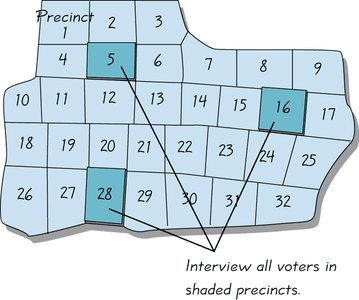
Cluster sampling divides the population into clusters, randomly selects some clusters, and includes all members from selected clusters.
Useful for geographically dispersed populations.
Variables in Research
Definition and Types
A variable is any characteristic or condition that can change or take on different values. Research often investigates relationships between two or more variables.
Discrete Variables: Take on a finite or countable number of values (e.g., number of patients).
Continuous Variables: Can take on infinitely many values within a range (e.g., weight, blood pressure).
Levels of Measurement
Overview
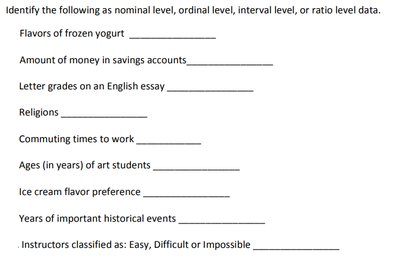
The level of measurement determines which statistical calculations are meaningful. There are four levels: nominal, ordinal, interval, and ratio.
Level | Description | Examples |
|---|---|---|
Nominal | Qualitative; categories only, no order, no math | Colors, names, types |
Ordinal | Ordered categories, but differences not meaningful | Class standings, rankings |
Interval | Ordered, equal intervals, no true zero | Temperature, years |
Ratio | Ordered, equal intervals, true zero | Height, weight, length |
Nominal Level
Nominal data are qualitative and consist of names, labels, or categories. No mathematical computations are possible.
Examples: Colors in a flag, student names, textbook titles.
Ordinal Level
Ordinal data are qualitative and can be arranged in order, but differences between entries are not meaningful.
Examples: Class standings, player numbers, song rankings.
Interval Level
Interval data are quantitative, ordered, and have equal intervals, but zero does not represent the absolute lowest value.
Examples: Temperatures (Fahrenheit), years on a timeline.
Ratio Level
Ratio data are quantitative, ordered, have equal intervals, and a true zero. Zero means none of the variable exists.
Examples: Height, weight, length.
Key Distinctions
Nominal: Categories only, no order, no math
Ordinal: Ordered categories, no meaningful differences
Interval: Ordered, equal intervals, no true zero
Ratio: Ordered, equal intervals, true zero
Summary Table
Concept | Definition |
|---|---|
Population | Entire group of interest |
Sample | Subset of population |
Parameter | Numerical value describing population |
Statistic | Numerical value describing sample |
Sampling Error | Difference between statistic and parameter |
Simple Random Sample | Every sample equally likely |
Systematic Sampling | Select every kth element |
Stratified Sampling | Sample from each subgroup |
Cluster Sampling | Sample all members from selected clusters |
Discrete Variable | Finite/countable values |
Continuous Variable | Infinite values within range |
Nominal | Categories only |
Ordinal | Ordered categories |
Interval | Ordered, equal intervals, no true zero |
Ratio | Ordered, equal intervals, true zero |
Key Formulas
Sampling Error Formula
The sampling error is calculated as:
Probability of Simple Random Sample
For a population of size N and sample size n:
Conclusion
Understanding populations, samples, sampling methods, variables, and levels of measurement is foundational for descriptive statistics and for conducting meaningful health science research. These concepts enable researchers to collect, analyze, and interpret data accurately, ensuring valid and reliable conclusions.
