 Back
BackDescriptive Statistics: Measures of Center and Variation
Study Guide - Smart Notes
 Tailored notes based on your materials, expanded with key definitions, examples, and context.
Measures of Center
Mean (Arithmetic Average)
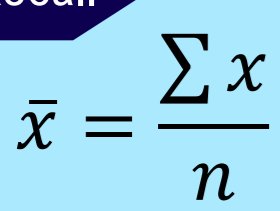
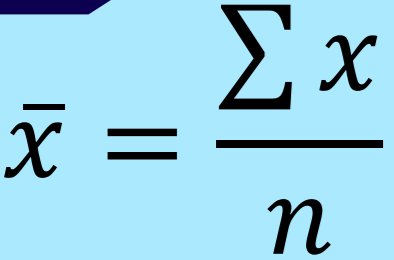
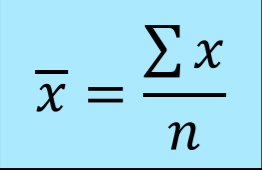
The mean is a measure of center that summarizes a data set in a single value, representing the "average" of all data points. It is calculated by adding all values and dividing by the total number of values.
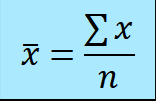
Formula:
Population Mean:
Sample Mean:
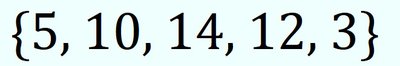
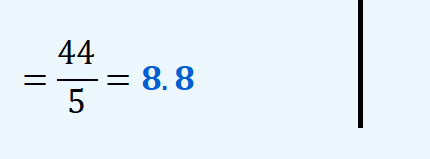
Example: For the data set {5, 10, 14, 12, 3}, the mean is
Properties: The mean uses all values in the data set, but is sensitive to outliers (extreme values).


Median
The median is the middle value in a sorted data set. It is another measure of center, less affected by outliers than the mean.
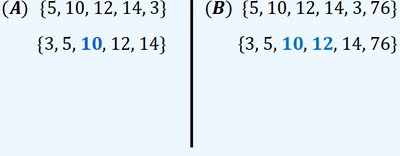
Finding the Median: Sort the data from smallest to largest. If the number of values is odd, the median is the middle value. If even, it is the average of the two middle values.
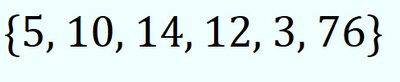
Example: For {3, 5, 10, 12, 14}, the median is 10. For {3, 5, 10, 12, 14, 76}, the median is (10+12)/2 = 11.
Advantages: The median is resistant to outliers.
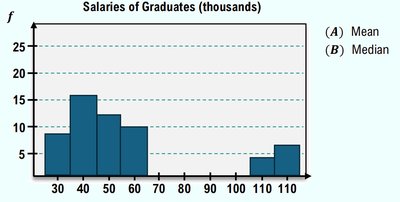
Mean vs. Median
Both mean and median are measures of center, but they have distinct advantages and disadvantages.
Mean: Best for symmetric data without outliers; uses all values; not resistant to outliers.
Median: Best for skewed data or data with outliers; resistant to outliers; does not use all values.
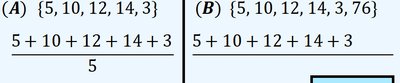
Example: In a data set with a large outlier, the mean will be pulled toward the outlier, while the median remains more representative of the central tendency.
Measures of Variation
Standard Deviation
The standard deviation is a measure of variation that describes how spread out the values in a data set are. It quantifies the average distance of each data point from the mean.
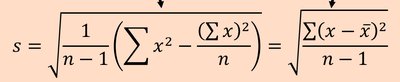
Formula (Sample):
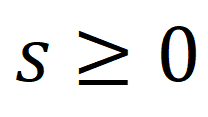
Properties: Standard deviation is always non-negative (). A larger standard deviation indicates more spread out data.
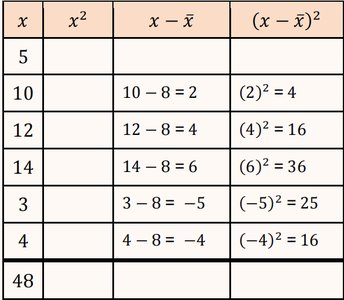
Example: For the data set {5, 10, 12, 14, 3, 4}, calculate the mean, then find each deviation, square it, sum, and divide by n-1, then take the square root.


Interpreting Standard Deviation
Empirical Rule (68-95-99.7 Rule): For bell-shaped (normal) distributions, about 68% of data falls within 1 standard deviation of the mean, 95% within 2, and 99.7% within 3.
Range Rule of Thumb: Values more than 2 standard deviations from the mean are considered significant (unusual).
Summary Table: Mean vs. Median vs. Standard Deviation
Measure | Definition | Best Use | Resistant to Outliers? |
|---|---|---|---|
Mean | Average of all values | Symmetric data | No |
Median | Middle value in sorted data | Skewed data, outliers | Yes |
Standard Deviation | Average spread from mean | Quantifying variation | No |
