 Back
Descriptive Statistics: Measures of Variation and Position
Study Guide - Smart Notes
 Tailored notes based on your materials, expanded with key definitions, examples, and context.
Measures of Variation
Range
The range is the simplest measure of variation in a data set. It is calculated as the difference between the maximum and minimum values in a quantitative data set.
Formula: Range = (Maximum value) – (Minimum value)
Example: For starting salaries: 41, 38, 39, 45, 47, 41, 44, 41, 37, 42, the range is 47 – 37 = 10 ($10,000).
Deviation, Variance, and Standard Deviation
These measures describe how data entries deviate from the mean, providing insight into the spread of the data.
Deviation: The difference between a data entry and the mean.
Population: deviation of x = x – μ
Sample: deviation of x = x – \bar{x}
Population Variance: The average of the squared deviations from the mean.
Formula:
Population Standard Deviation: The square root of the variance.
Formula:
Sample Variance: Uses n-1 in the denominator to correct for bias.
Formula:
Sample Standard Deviation: The square root of the sample variance.
Formula:
Example: For the starting salaries, the sample standard deviation is about 3.1 ($3,100).
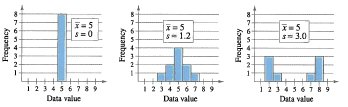
Interpreting Standard Deviation
The standard deviation measures the typical amount an entry deviates from the mean. Larger standard deviations indicate more spread out data.
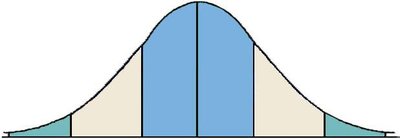
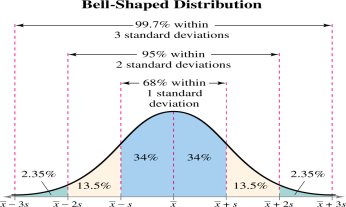
Empirical Rule (68–95–99.7 Rule)
For data with a symmetric, bell-shaped distribution, the Empirical Rule describes the proportion of data within 1, 2, and 3 standard deviations of the mean:
About 68% within 1 standard deviation
About 95% within 2 standard deviations
About 99.7% within 3 standard deviations
Chebychev’s Theorem
Chebychev’s Theorem applies to any data set, regardless of distribution shape. It states that at least of the data lies within k standard deviations of the mean (for k > 1).
For k = 2: At least 75% within 2 standard deviations
For k = 3: At least 88.9% within 3 standard deviations
Standard Deviation for Grouped Data
When data is grouped into classes, use class midpoints and frequencies to estimate the sample mean and standard deviation.
Formula: where n = total frequency
Example: For 50 households, the sample mean number of children is about 1.8, and the standard deviation is about 1.7.
Coefficient of Variation (CV)
The coefficient of variation expresses the standard deviation as a percentage of the mean, allowing comparison of variability between different data sets.
Population:
Sample:
Example: Comparing heights and weights of a basketball team:
Heights | Weights |
|---|---|
72 | 180 |
74 | 168 |
68 | 225 |
76 | 201 |
74 | 189 |
69 | 192 |
72 | 197 |
79 | 162 |
70 | 174 |
69 | 171 |
77 | 185 |
73 | 210 |
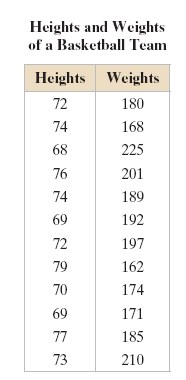
Heights: CV ≈ 4.5%
Weights: CV ≈ 9.4%
Interpretation: Weights are more variable than heights.
Measures of Position
Quartiles
Quartiles are fractiles that divide an ordered data set into four equal parts:
Q1: First quartile, about 25% of data below
Q2: Second quartile (median), about 50% below
Q3: Third quartile, about 75% below
Example: For nuclear power plants in 15 countries, Q1 = 10, Q2 = 18, Q3 = 31.
Interquartile Range (IQR)
The interquartile range measures the spread of the middle 50% of the data:
Formula: IQR = Q3 – Q1
Example: IQR = 31 – 10 = 21
Box-and-Whisker Plot
A box-and-whisker plot is a graphical tool that displays the five-number summary (minimum, Q1, median, Q3, maximum) and highlights the spread and possible outliers in a data set.
Steps: Find five-number summary, construct scale, plot points, draw box from Q1 to Q3, mark median, draw whiskers to min and max.
Interpretation: The length of whiskers can indicate outliers.
Percentiles and Other Fractiles
Fractiles partition data into equal parts:
Type | Divides Data Into | Symbols |
|---|---|---|
Quartiles | 4 parts | Q1, Q2, Q3 |
Deciles | 10 parts | D1, D2, ..., D9 |
Percentiles | 100 parts | P1, P2, ..., P99 |
Example: SAT scores and percentiles.
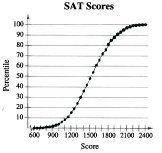
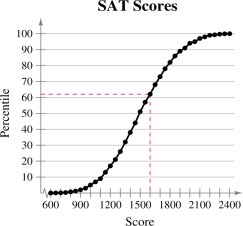
62nd percentile corresponds to a score of 1600: 62% of students scored 1600 or less.
Standard Score (z-score)
The z-score indicates how many standard deviations a value is from the mean. It allows comparison across different data sets.
Formula:
Example: Heath Ledger's z-score for age at Oscar win: ; Penelope Cruz:
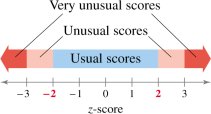
Interpretation: Scores between -2 and 2 are considered usual; outside this range are unusual or very unusual.
Summary
Found the range, variance, and standard deviation for populations and samples
Used Empirical Rule and Chebychev’s Theorem to interpret standard deviation
Approximated sample standard deviation for grouped data
Used coefficient of variation to compare variation in different data sets
Found quartiles, interquartile range, and represented data with box-and-whisker plots
Interpreted percentiles and z-scores for measures of position
