 Back
Discrete and Binomial Probability Distributions: Concepts, Formulas, and Applications
Study Guide - Smart Notes
 Tailored notes based on your materials, expanded with key definitions, examples, and context.
Random Variables and Probability Distributions
Basic Concepts of Probability Distribution
A random variable is a variable whose values are determined by chance. Random variables are fundamental in statistics for modeling outcomes of random processes.
Discrete Random Variable: Takes on a finite or countable number of values (e.g., number of heads in coin tosses, number of children in a family).
Continuous Random Variable: Can take any value within a range, including decimals and fractions (e.g., weight, temperature).
A probability distribution lists all possible outcomes of a random variable and their corresponding probabilities. These probabilities can be determined theoretically or by observation and are often presented in tables, graphs, or formulas.
Requirements for Probability Distributions
There is a numerical random variable, x, with associated probabilities.
The sum of all probabilities must be 1.
Each probability value must be between 0 and 1, inclusive.
Discrete Probability Distributions
Definition and Examples
A discrete probability distribution consists of the values a discrete random variable can assume and their corresponding probabilities.
Example 1: Coin Toss – Tossing two coins, let X be the number of heads. Possible outcomes: 0, 1, or 2 heads.
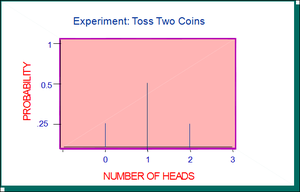
Example 2: Number of Girls in Two Births – Possible outcomes: 0, 1, or 2 girls.
Probability Distribution Table
Probability distributions are often represented in tables. For example, the probability distribution for the number of girls in two births:
Number of Girls (x) | Probability P(x) |
|---|---|
0 | 0.25 |
1 | 0.50 |
2 | 0.25 |
Additional info: Probabilities are calculated based on the assumption that each child is equally likely to be a girl or a boy.
Probability Histogram
A probability histogram visually represents the probability distribution of a discrete random variable.
Formulas for Discrete Probability Distributions
Mean (Expected Value):
Variance:
Variance (Shortcut):
Standard Deviation:
Identifying Unusual Results: Range Rule of Thumb
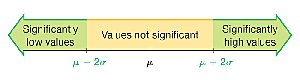
The range rule of thumb helps identify significantly low or high values in a probability distribution:
Significantly low values: or lower
Significantly high values: or higher
Values not significant: Between and
Expected Value
Definition and Calculation
The expected value (E) of a discrete random variable is the mean value of its outcomes, calculated as:
This value represents the long-term average if the experiment is repeated many times.
Binomial Probability Distribution
Definition and Requirements
A binomial probability distribution arises from a procedure that meets these requirements:
Fixed number of trials (n).
Each trial is independent.
Each trial has only two possible outcomes: success (S) or failure (F).
The probability of success (p) remains the same for each trial.
Notation
n: Number of trials
x: Number of successes in n trials
p: Probability of success in one trial
q: Probability of failure in one trial ()
P(x): Probability of getting exactly x successes

Binomial Probability Formula
The probability of getting exactly x successes in n independent trials is given by:
Where denotes the factorial of n.
Methods for Calculating Binomial Probabilities
Using the general formula for the binomial distribution
Using binomial probability tables
Using statistical software or calculators
Parameters of the Binomial Probability Distribution
Mean:
Variance:
Standard Deviation:
Range Rule of Thumb for Binomial Distributions
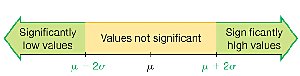
To identify significantly low or high values in a binomial distribution, use:
Significantly low: or lower
Significantly high: or higher
Not significant: Between and
Applications and Examples
Example: Probability of Knowing Twitter
Given a probability of 0.85 that an adult knows of Twitter, the probability of exactly 3 out of 5 adults knowing Twitter can be found using the binomial formula with n = 5, x = 3, p = 0.85, q = 0.15.
Example: Probability Table Usage
For a sample of 15 males with a 40% smoking rate, the probability that exactly 12 smoke is found using a binomial probability table: n = 15, x = 12, p = 0.4.
Example: McDonald's Recognition Rate
With a 95% recognition rate and a group of 12 adults, the mean, variance, and standard deviation for the number recognizing McDonald's are calculated as:
Mean:
Variance:
Standard Deviation:
The range rule of thumb is then used to determine if 12 recognitions is significantly high.
Example: Probability of Twins
If 2% of births result in twins, for a sample of 8000 births, the mean, variance, and standard deviation for the number of twin births are calculated using the binomial parameters.
Example: Teenagers with Part-Time Jobs
If 30% of teenagers have part-time jobs, and 5 are selected at random, the probability that at least 3 have part-time jobs is found using the binomial probability table.
Additional info: These examples illustrate the practical application of discrete and binomial probability distributions in real-world scenarios, such as marketing surveys, health statistics, and social research.
