 Back
Discrete Probability Distributions and Binomial Probability
Study Guide - Smart Notes
 Tailored notes based on your materials, expanded with key definitions, examples, and context.
Probability Distributions
Random Variables
A random variable is a variable whose value is determined by chance for each outcome of a procedure. It is typically denoted by x.
Discrete Random Variable: Has a finite or countable set of values (e.g., number of coin tosses).
Continuous Random Variable: Has infinitely many values, not countable, often measured on a continuous scale (e.g., body temperature).
Probability Distribution
A probability distribution assigns probabilities to each possible value of a random variable. It can be represented as a table or graph.
Each value of x is associated with a probability P(x).
The sum of all probabilities must equal 1: .
Each probability must be between 0 and 1: .
Example: Identifying Probability Distributions
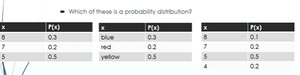
Consider the following tables:
x | P(x) |
|---|---|
8 | 0.3 |
7 | 0.2 |
5 | 0.5 |
x | P(x) |
|---|---|
blue | 0.3 |
red | 0.2 |
yellow | 0.5 |
x | P(x) |
|---|---|
8 | 0.1 |
7 | 0.2 |
5 | 0.5 |
4 | 0.2 |
The first and third tables are probability distributions because x is numerical and the probabilities sum to 1. The second table is not a probability distribution because x is categorical.
Parameters of a Probability Distribution
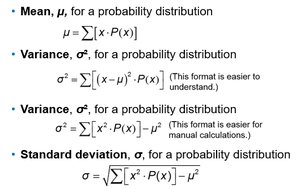
For probability distributions, the mean, variance, and standard deviation are parameters describing the population.
Mean (μ):
Variance (σ²): or
Standard Deviation (σ):
Example: Tossing Two Coins
Probability distribution for number of heads:
x | P(x) |
|---|---|
0 | 0.25 |
1 | 0.50 |
2 | 0.25 |
Mean: 1.0 head, Variance: 0.50 heads², Standard deviation: 0.7 head.
Uniform Distribution
A uniform distribution (rectangular distribution) has constant probability across its range. It is defined by two parameters: a (minimum) and b (maximum), written as U(a, b).
Probability for an interval:
Example: Waiting Time for a Bus
If waiting time is uniformly distributed between 0 and 15 minutes, the probability of waiting less than 12.5 minutes is .
Binomial Probability Distributions
Definition and Properties
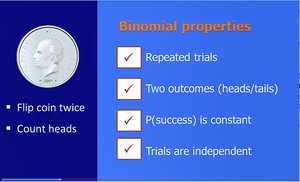
A binomial probability distribution arises from a process with:
Fixed number of trials (n)
Independent trials
Each trial has two outcomes: success (S) or failure (F)
Probability of success (p) is constant
Binomial Probability Formula
The probability of getting exactly x successes in n trials:
, where
Mean, Variance, and Standard Deviation for Binomial Distribution
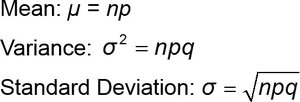
Mean:
Variance:
Standard Deviation:

Example: Coin Toss
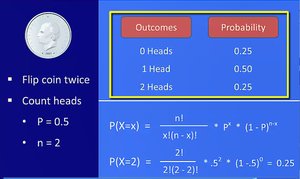
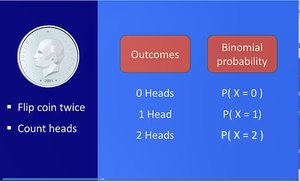
Flipping a coin twice and counting heads:
Outcomes: 0, 1, or 2 heads
Probabilities: P(0) = 0.25, P(1) = 0.50, P(2) = 0.25
Example: Calculating Binomial Probabilities
Jessica makes 80% of free throws. Probability she makes exactly 7 out of 10:
A bank finds 3% of transactions are fraudulent. Probability exactly 2 out of 20 are fraudulent:
Practice Problems
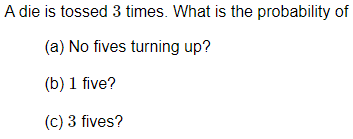
A die is tossed 3 times. What is the probability of (a) no fives, (b) 1 five, (c) 3 fives?
A sharpshooter hits the target 4 times out of 5 on average. If 5 shots are fired, what is the probability of (a) more than 4 hits, (b) at least 3 misses?
In the old days, probability of making a telephone call was 0.6. What is the probability of 7 successes in 10 attempts?

Summary Table: Binomial Distribution Parameters
Parameter | Formula |
|---|---|
Mean | |
Variance | |
Standard Deviation |
Conclusion
Discrete probability distributions, including binomial and uniform distributions, are fundamental in statistics for modeling random processes and calculating probabilities. Understanding their properties, formulas, and applications is essential for analyzing statistical data.
