 Back
BackDiscrete Probability Distributions: Binomial Experiments and Binomial Probability
Study Guide - Smart Notes
 Tailored notes based on your materials, expanded with key definitions, examples, and context.
Discrete Probability Distributions
Probability Distributions
A probability distribution describes how probabilities are distributed over the values of a random variable. In discrete probability distributions, the random variable can take on a finite or countable number of values, each associated with a probability.
Random Variable: A variable whose value is determined by the outcome of a probability experiment.
Discrete Random Variable: Takes on distinct, separate values (e.g., number of successes).
Probability Distribution: Assigns a probability to each possible value of the random variable.
Binomial Distributions
The binomial distribution is a discrete probability distribution that models the number of successes in a fixed number of independent trials, each with the same probability of success.
Binomial Experiment Characteristics:
The experiment is repeated for a fixed number of trials (n).
Each trial is independent.
Each trial has only two possible outcomes: success (S) or failure (F).
The probability of success (p) is constant for each trial.
The random variable x counts the number of successful trials.
Notation:
n: Number of trials
p: Probability of success
q: Probability of failure (q = 1 - p)
x: Number of successes in n trials
Examples of Binomial Experiments
A COVID-19 rapid test is either positive or negative.
A student answers a multiple-choice question correctly or incorrectly.
A survey response is “yes, I will buy” or “no, I will not” a new car this year.
New job applicants either accept or reject an offer.
Identifying Binomial Experiments
To determine if an experiment is binomial, check for the following:
Fixed number of trials
Independence of trials
Two possible outcomes per trial
Constant probability of success
Example: A doctor performs a surgical procedure with an 85% success rate on eight patients. The random variable x is the number of successful surgeries. This is a binomial experiment with n = 8, p = 0.85, q = 0.15, and x = 0, 1, ..., 8.

Counterexample: Drawing marbles from a jar without replacement is not a binomial experiment because the probability of success changes and trials are not independent.

Binomial Probability Formula
The probability of exactly x successes in n trials is given by the binomial probability formula:
Formula:
n: Number of trials
x: Number of successes
p: Probability of success
q: Probability of failure (q = 1 - p)
Example: Finding a Binomial Probability
Rotator cuff surgery has a 90% chance of success. The surgery is performed on three patients. Find the probability that exactly two surgeries are successful.
n = 3, p = 0.90, q = 0.10, x = 2
Apply the formula:
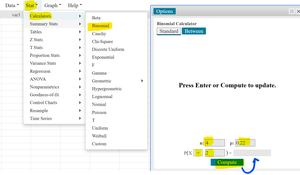
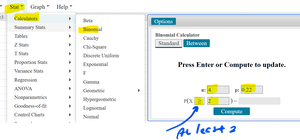
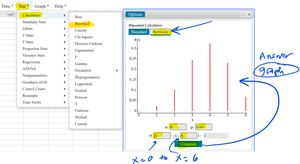
Finding Binomial Probabilities Using Technology
Statistical software such as StatCrunch can be used to quickly compute binomial probabilities. The user inputs n, p, and x, and the software calculates the probability.

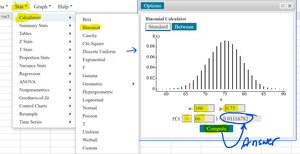
Example: Digital Device Fatigue
75% of U.S. adults are experiencing digital device fatigue. If 100 adults are randomly selected, what is the probability that exactly 66 are experiencing fatigue?
n = 100, p = 0.75, x = 66
Use StatCrunch to compute the probability.
Constructing and Graphing a Binomial Distribution
To construct a binomial probability distribution, calculate the probability for each possible value of x (number of successes) and organize the results in a table or graph.
Example: In a survey, 48% of U.S. adults go online several times a day. If six adults are randomly selected, construct the binomial distribution for the number who respond affirmatively.
n = 6, p = 0.48, q = 0.52, x = 0, 1, ..., 6
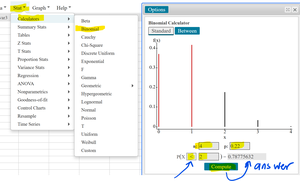
Finding Binomial Probabilities for Multiple Outcomes
To find probabilities for outcomes such as "at least two" or "fewer than two," sum the probabilities for the relevant values of x.
Example: 22% of U.S. adults say the economy is the most important problem. For four adults, find the probability that exactly two, at least two, or fewer than two respond yes.
n = 4, p = 0.22, q = 0.78
Graphing a Binomial Distribution
Graphing the binomial distribution helps visualize the likelihood of different outcomes. The sum of all probabilities must equal 1, and each probability must be between 0 and 1.
Example: 64% of cancer survivors are 65 years or older. For six randomly selected survivors, graph the probability distribution for the number who are 65 or older.
n = 6, p = 0.64, q = 0.36
Mean, Variance, and Standard Deviation of a Binomial Distribution
The mean, variance, and standard deviation of a binomial distribution can be calculated using the following formulas:
Mean:
Variance:
Standard Deviation:
Example: Cloudy Days in June
In Pittsburgh, 56% of days in June are cloudy. For 30 days, calculate the mean, variance, and standard deviation.
n = 30, p = 0.56, q = 0.44
Mean:
Variance:
Standard Deviation:
Values more than two standard deviations from the mean are considered unusual.
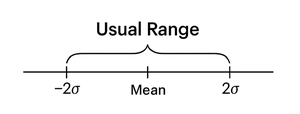
A June with 11 cloudy days or fewer, or 23 cloudy days or more, would be unusual.
Summary Table: Binomial Distribution Properties
Property | Formula |
|---|---|
Mean | |
Variance | |
Standard Deviation |
Additional info: The notes include StatCrunch screenshots to illustrate technology-based calculation of binomial probabilities and distributions, reinforcing the practical application of statistical software in binomial analysis.
