Back
Discrete Probability Distributions: Introductory Statistics Ch. 5 Study Notes
Study Guide - Smart Notes
 Tailored notes based on your materials, expanded with key definitions, examples, and context.
Discrete Probability Distributions
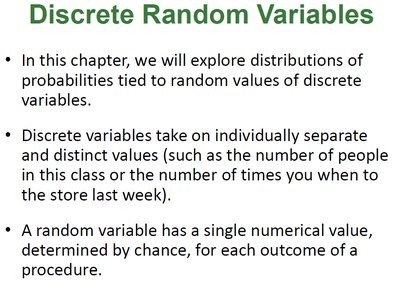
Discrete Random Variables
Discrete random variables are fundamental in probability theory and statistics. They represent values that are countable and distinct, such as the number of people in a room or the number of times an event occurs.
Discrete variables take on individually separate and distinct values.
A random variable assigns a single numerical value, determined by chance, to each outcome of a procedure.
Examples include the number of people in a class or the number of times you went to the store last week.
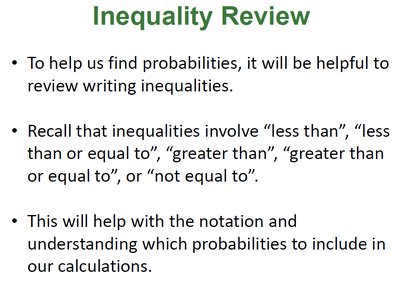
Inequality Review
Understanding inequalities is essential for interpreting probability statements and calculating probabilities for discrete random variables.
Inequalities include "less than", "less than or equal to", "greater than", "greater than or equal to", and "not equal to".
These notations help specify which probabilities to include in calculations.
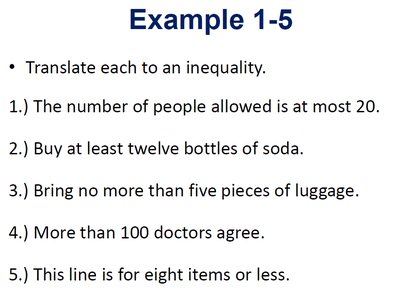
Example: Translating Statements to Inequalities
"At most 20" translates to
"At least twelve" translates to
"No more than five" translates to
"More than 100" translates to
"Eight items or less" translates to
Probability Distributions
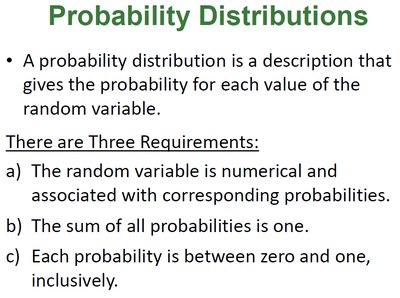
A probability distribution describes the likelihood of each possible value of a random variable. For discrete random variables, the distribution is often presented as a table or graph.
Requirement 1: The random variable is numerical and associated with corresponding probabilities.
Requirement 2: The sum of all probabilities is one.
Requirement 3: Each probability is between zero and one, inclusively.
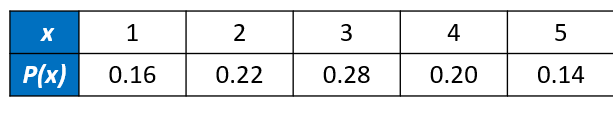
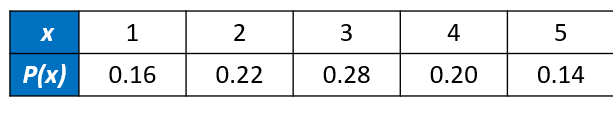
Example Probability Distribution Table
x | 1 | 2 | 3 | 4 | 5 |
|---|---|---|---|---|---|
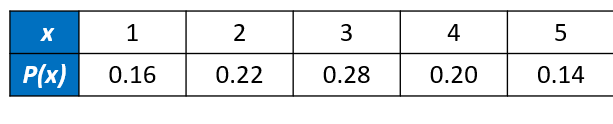
P(x) | 0.16 | 0.22 | 0.28 | 0.20 | 0.14 |
Identifying Valid Probability Distributions
To determine if a table or graph represents a valid probability distribution, check the three requirements listed above.
Probabilities must be non-negative and not exceed 1.
The sum of all probabilities must equal 1.
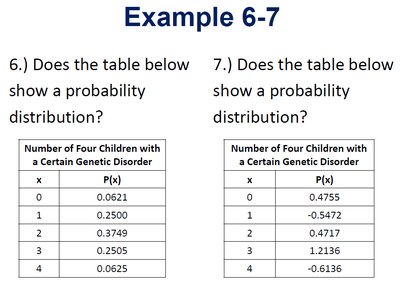
Examples: Validity of Probability Distributions
x | 0 | 1 | 2 | 3 | 4 |
|---|---|---|---|---|---|
P(x) | 0.0621 | 0.2500 | 0.3749 | 0.2505 | 0.0625 |
This table is valid: all probabilities are between 0 and 1, and their sum is 1.
x | 0 | 1 | 2 | 3 | 4 |
|---|---|---|---|---|---|
P(x) | 0.4755 | -0.5472 | 0.4717 | 1.2136 | -0.6136 |
This table is not valid: some probabilities are negative or greater than 1.
More Examples
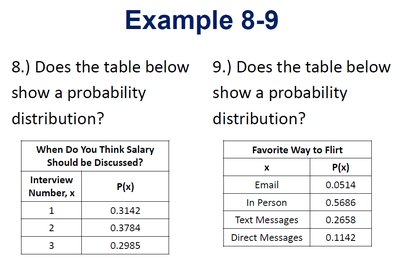
Interview Number, x | 1 | 2 | 3 |
|---|---|---|---|
P(x) | 0.3142 | 0.3784 | 0.2985 |
x | In Person | Text Messages | Direct Messages | |
|---|---|---|---|---|
P(x) | 0.0514 | 0.5686 | 0.2658 | 0.1142 |
Graphical Examples
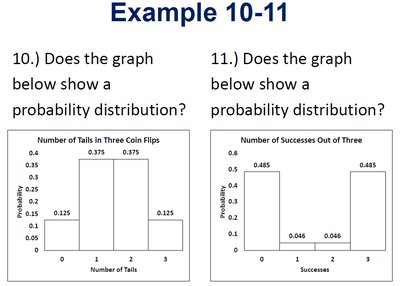
Probability distributions can also be represented graphically. The heights of the bars correspond to the probabilities for each value of the random variable.
Using Probability Distributions to Find Probabilities
Probability distributions allow us to answer questions about the likelihood of certain outcomes.
To find the probability of a specific outcome, locate the value in the table or graph and read its probability.
To find the probability of a range of outcomes, sum the probabilities for those values.
Example Probability Distribution Table
x | 1 | 2 | 3 | 4 | 5 |
|---|---|---|---|---|---|
P(x) | 0.16 | 0.22 | 0.28 | 0.20 | 0.14 |
Examples: Calculating Probabilities
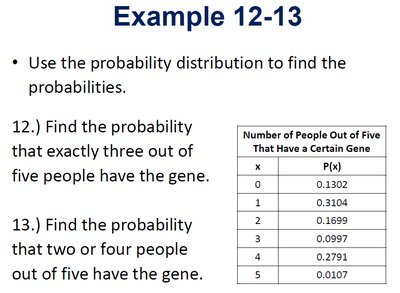
Exactly three out of five people have the gene:
Two or four out of five people have the gene:
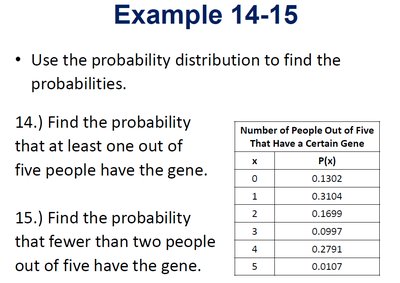
At least one out of five people have the gene:
Fewer than two people have the gene:
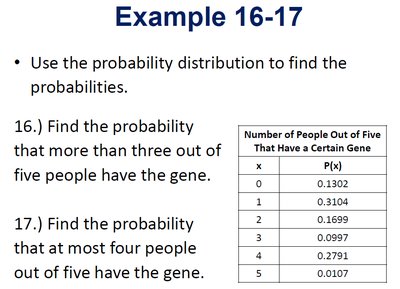
More than three people have the gene:
At most four people have the gene:
Discrete Distribution Descriptive Statistics
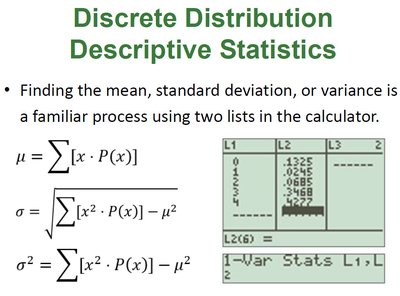
Descriptive statistics for discrete probability distributions include the mean, variance, and standard deviation. These summarize the central tendency and spread of the distribution.
Mean (Expected Value):
Variance:
Standard Deviation:
Example: Calculating Mean, Variance, and Standard Deviation
x | 1 | 2 | 3 | 4 | 5 |
|---|---|---|---|---|---|
P(x) | 0.16 | 0.22 | 0.28 | 0.20 | 0.14 |
Mean:
Variance:
Standard Deviation:
Examples: Mean, Variance, and Standard Deviation from Graphs and Tables
For a graph showing the number of tails in three coin flips, calculate mean, variance, and standard deviation using the probabilities for each outcome.
For a table showing the number of people out of five with a certain gene, use the same formulas.
Identifying Unusual Values
To determine if a value is unusual, compare it to the mean and standard deviation. Values more than two standard deviations above or below the mean are considered unusual.
Calculate and for the distribution.
Check if the value lies outside .