 Back
BackDiscrete Probability Distributions: Probability, Mean, Variance, and Standard Deviation
Study Guide - Smart Notes
 Tailored notes based on your materials, expanded with key definitions, examples, and context.
Discrete Probability Distributions
Introduction to Discrete Probability Distributions
Discrete probability distributions describe the probabilities of outcomes for discrete random variables. These distributions are foundational in statistics for modeling and analyzing random processes where outcomes are countable and distinct.
Probability Distributions
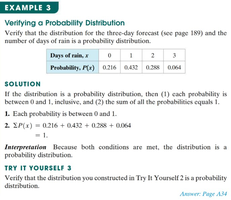
A probability distribution assigns a probability to each possible value of a discrete random variable. The sum of all probabilities in a distribution must equal 1, and each probability must be between 0 and 1, inclusive.
Random Variable (x): A variable that represents the possible outcomes of a probability experiment.
Probability (P(x)): The likelihood that the random variable takes a specific value.
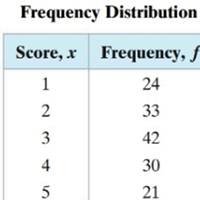
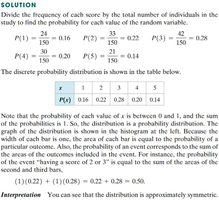
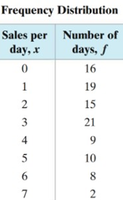
To construct a probability distribution, divide the frequency of each outcome by the total number of observations.
Key Properties of Probability Distributions
Each probability is between 0 and 1:
The sum of all probabilities is 1:
Example: If the probability distribution for the number of days of rain in a three-day forecast is given by , , , , then the sum confirms it is a valid probability distribution.
Identifying Probability Distributions
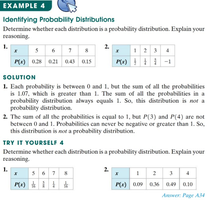
To determine if a table represents a probability distribution, check that all probabilities are between 0 and 1 and that their sum is exactly 1. If either condition fails, it is not a valid probability distribution.
Constructing Probability Distributions from Data
Given a frequency distribution, you can construct a probability distribution by dividing each frequency by the total number of observations. This process is essential for analyzing real-world data, such as employee sales or survey results.
Mean, Variance, and Standard Deviation of Discrete Probability Distributions
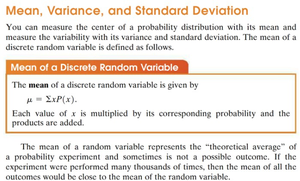
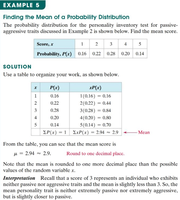
Mean of a Discrete Random Variable
The mean (expected value) of a discrete random variable is the theoretical average of all possible outcomes, weighted by their probabilities. It is calculated as:
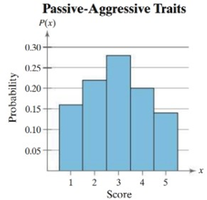
Example: For the probability distribution of passive-aggressive traits, the mean is calculated by multiplying each score by its probability and summing the results.
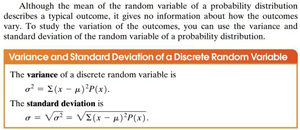
Variance and Standard Deviation
The variance measures the spread of the probability distribution, indicating how much the values of the random variable differ from the mean. The standard deviation is the square root of the variance and provides a measure of dispersion in the same units as the random variable.
Variance:
Standard Deviation:
Applications and Interpretation
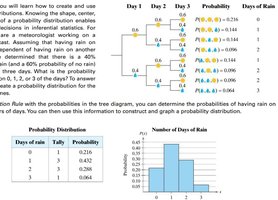
Tree Diagrams and Probability Distributions
Tree diagrams can be used to visualize and calculate the probabilities of different outcomes in multi-stage experiments, such as the probability of rain over several days. By multiplying probabilities along each branch and summing for each outcome, you can construct a probability distribution.
Interpreting Probability Distributions
Probability distributions allow statisticians to summarize and analyze the likelihood of various outcomes. The mean provides a measure of central tendency, while the variance and standard deviation describe the variability of the distribution. These concepts are essential for making informed decisions based on data.
Summary Table: Key Formulas
Concept | Formula (LaTeX) | Description |
|---|---|---|
Mean (Expected Value) | Theoretical average of the random variable | |
Variance | Measure of spread around the mean | |
Standard Deviation | Square root of variance; dispersion in original units |
