 Back
BackDiscrete Probability Distributions: Study Guide for Elementary Statistics
Study Guide - Smart Notes
 Tailored notes based on your materials, expanded with key definitions, examples, and context.
Discrete Probability Distributions
Introduction to Random Variables
A random variable is a numerical value determined by the outcome of a random process. It assigns a number to each possible outcome of an experiment, and its value is uncertain until the event occurs. Random variables are fundamental in statistics for quantifying uncertainty and modeling real-world phenomena.
Discrete random variables: Take on a countable number of distinct values (e.g., number of heads in coin tosses).
Continuous random variables: Can assume any value within a given range (e.g., height, weight).
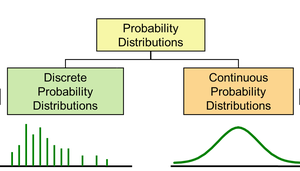
Discrete Probability Distributions
A discrete probability distribution lists each possible value a discrete random variable can assume, along with its probability. These distributions must satisfy two conditions:
Each probability is between 0 and 1, inclusive.
The sum of all probabilities is 1.
Constructing a Discrete Probability Distribution
To construct a discrete probability distribution:
List all possible outcomes for the random variable.
Make a frequency distribution for these outcomes.
Find the sum of the frequencies.
Calculate the probability for each outcome by dividing its frequency by the total frequency.
Verify that each probability is between 0 and 1, and that their sum is 1.
Example: Tossing Two Coins
Let x = number of heads when tossing two coins. The possible outcomes and their probabilities are:
0 heads: TT (Probability = 1/4)
1 head: HT, TH (Probability = 2/4)
2 heads: HH (Probability = 1/4)

Verifying a Probability Distribution
To verify if a distribution is a probability distribution, check:
Each probability is between 0 and 1, inclusive.
The sum of all probabilities equals 1.
If both conditions are met, it is a valid probability distribution.


If any probability is negative or greater than 1, or the sum is not 1, it is not a probability distribution.


Mean, Variance, and Standard Deviation of a Discrete Probability Distribution
Mean (Expected Value)
The mean or expected value of a discrete probability distribution is calculated as:
Multiply each value of x by its corresponding probability.
Add the products.
Formula:
Variance and Standard Deviation
The variance measures the spread of values around the mean. The standard deviation is the square root of the variance.
Formulas:
Variance:
Standard Deviation:
Example: Personality Inventory Test
Suppose a personality inventory test assigns scores from 1 (extremely passive) to 5 (extremely aggressive). The mean score is calculated using the formula above, indicating the average trait in the population.
Expected Value in Real-Life Applications
The expected value is the long-run average outcome of a random variable. For example, in a raffle with 1500 tickets sold at $2 each and four prizes, the expected value for a ticket buyer is calculated by summing the products of each possible outcome and its probability.
Interpretation: If the expected value is negative, you can expect to lose money on average per ticket.
Using Technology: StatCrunch for Mean and Standard Deviation
Statistical software like StatCrunch can be used to quickly compute the mean and standard deviation of a discrete probability distribution. Enter the values and probabilities, and use the software's functions to obtain results.

Summary Table: Properties of Discrete Probability Distributions
Property | Description |
|---|---|
Probability Range | Each probability must be between 0 and 1, inclusive. |
Sum of Probabilities | The sum of all probabilities must equal 1. |
Mean (Expected Value) | Long-run average value, calculated as |
Variance | Measure of spread, calculated as |
Standard Deviation | Square root of variance, |
Additional info: Academic context and formulas have been expanded for completeness and clarity. Examples and applications are provided to reinforce understanding.
