Back
Dot Plots: Interpreting Coffee Consumption Data
Study Guide - Learn with Videos
 Curated lessons matched to your uploaded material – learn every topic step by step.
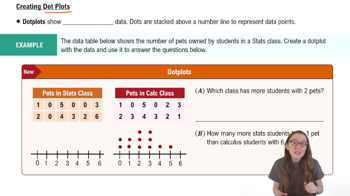
Dot Plots
- Guided course
 04:01

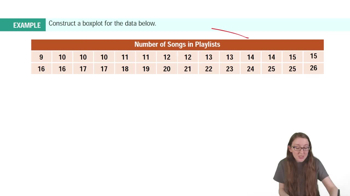
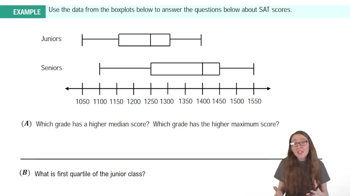
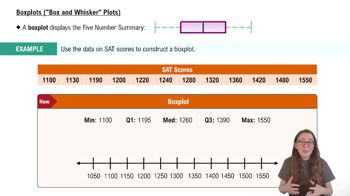
Boxplots
- Guided course 01:52
- Guided course 02:48
- Guided course 03:54
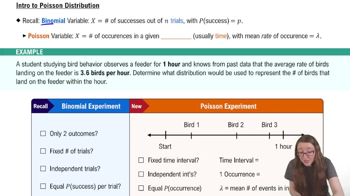
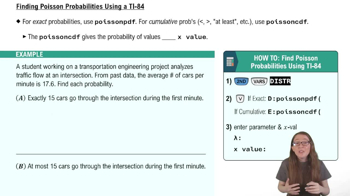
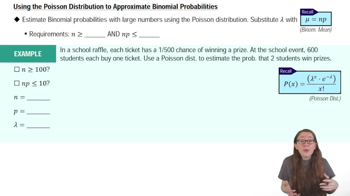
Poisson Distribution
- Guided course 04:00
- Guided course 03:37
- Guided course 04:09