Back
BackElementary Statistics – First Exam Review Study Notes
Study Guide - Smart Notes
 Tailored notes based on your materials, expanded with key definitions, examples, and context.
Chapter 1 – Introduction and Critical Thinking
Populations and Samples
Understanding the difference between a population (the entire group of interest) and a sample (a subset of the population) is fundamental in statistics.
Population: The complete set of individuals, items, or data under study.
Sample: A portion of the population selected for analysis.
Parameter: A numerical summary describing a population.
Statistic: A numerical summary describing a sample.
Example: If you survey 100 students at a university (sample) to estimate the average GPA of all students (population), the average GPA from your survey is a statistic, while the true average GPA is a parameter.
Types of Data
Data can be classified by their nature and measurement level.
Qualitative (Categorical) Data: Non-numeric data that describe categories or qualities (e.g., colors, names).
Quantitative Data: Numeric data representing counts or measurements.
Discrete Data: Countable values (e.g., number of students).
Continuous Data: Measurable values that can take any value within a range (e.g., height, weight).
Levels of Measurement: Nominal, Ordinal, Interval, Ratio.
Example: The number of cars in a parking lot (discrete), the temperature outside (continuous).
Critical Thinking in Statistics
Statistical thinking involves understanding the context, source, and methodology of data collection.
Identify the source of data and potential biases.
Distinguish between correlation and causation.
Recognize the importance of randomization and replication in studies.
Chapter 2 – Summarizing and Graphing Data
Frequency Distributions and Graphs
Data can be organized and visualized using various tables and graphs.
Frequency Distribution: A table that displays the frequency of various outcomes in a sample.
Relative Frequency: The proportion of observations within a category.
Histograms: Bar graphs representing the frequency of data within intervals.
Other Graphs: Bar graphs, pie charts, dotplots, stem-and-leaf plots, time-series graphs.
Example: A histogram showing the distribution of exam scores in a class.
Misleading Graphs
Graphs can be manipulated to misrepresent data. Always check axes, scales, and context.
Look for inconsistent scales or truncated axes.
Be wary of pictographs or 3D effects that exaggerate differences.
Chapter 3 – Statistics for Describing, Exploring, and Comparing Data
Measures of Center
Measures of center describe the typical value in a data set.
Mean: The arithmetic average.
Median: The middle value when data are ordered.
Mode: The value(s) that occur most frequently.
Midrange: The average of the highest and lowest values.
Example: For the data set 2, 4, 4, 5, 7: Mean = 4.4, Median = 4, Mode = 4, Midrange = 4.5.
Measures of Variation
Variation measures how spread out the data are.
Range: Difference between the highest and lowest values.
Standard Deviation (s): Measures average distance from the mean.
Variance (s2): The square of the standard deviation.
Example: For the data set 2, 4, 4, 5, 7: Range = 5, Standard deviation ≈ 1.82.
Measures of Relative Standing and Boxplots
Relative standing compares individual values to the rest of the data.
Z-score: Number of standard deviations a value is from the mean.
Percentiles: Indicate the relative position of a value in a data set.
Quartiles: Divide data into four equal parts.
Boxplot: A graphical summary based on the five-number summary (Min, Q1, Median, Q3, Max).
Identifying Outliers
Outliers are values that are unusually high or low compared to the rest of the data.
Common rule: A value is an outlier if it is more than 1.5 × IQR above Q3 or below Q1.
IQR (Interquartile Range):
Additional info:
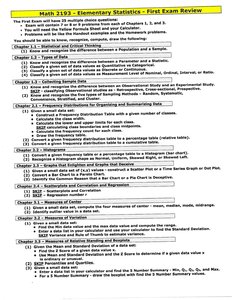
This review covers foundational concepts from Chapters 1–3, including definitions, calculations, and interpretation of basic statistical measures.
Students should be able to distinguish between types of data, construct and interpret graphs, and compute and interpret measures of center and variation.