 Back
BackEssential Formulas, Tables, and Procedures for College Statistics
Study Guide - Smart Notes
 Tailored notes based on your materials, expanded with key definitions, examples, and context.
Descriptive Statistics
Measures of Central Tendency and Dispersion
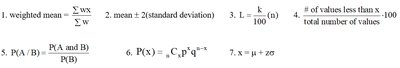
Descriptive statistics summarize and describe the main features of a dataset. The most common measures include the mean, weighted mean, and standard deviation.
Mean (Arithmetic Average): The sum of all values divided by the number of values.
Weighted Mean: Used when different values have different weights.
Mean from Frequency Table:
Standard Deviation: Measures the spread of data around the mean.
Variance: The square of the standard deviation.
Example: If a dataset has values 2, 4, 6, the mean is .
Percentiles and Ranking
Percentiles indicate the relative standing of a value within a dataset.
Percentile Rank:
Probability
Basic Probability Rules
Probability quantifies the likelihood of events occurring. Key rules include:
Mutually Exclusive Events:
Not Mutually Exclusive:
Independent Events:
Dependent Events:
Conditional Probability:
Rule of Complements:
Counting Principles: Permutations and Combinations
Permutations (no elements alike):
Permutations (some elements alike):
Combinations:
Binomial Probability
Binomial Probability Formula:
Mean:
Variance:
Standard Deviation:
Normal Distribution
Standard Scores (z-scores)
The normal distribution is a symmetric, bell-shaped curve describing many natural phenomena. Standard scores (z-scores) measure how many standard deviations a value is from the mean.
z-score:
Reverse formula:
Central Limit Theorem
Mean of sample means:
Standard error:
Confidence Intervals and Sample Size
Confidence Intervals for Proportions and Means
Confidence intervals estimate population parameters with a specified probability.
Proportion:
Mean (s unknown):
Mean (s known):
Sample Size Determination
For Proportion:
For Mean:
Hypothesis Testing
Procedure for Hypothesis Tests
Hypothesis testing is a formal procedure for comparing observed data with a claim about a population.
Identify the Claim: State the claim to be tested in symbolic form.
Give Symbolic Form: Express the claim and its negation symbolically.
Identify Null and Alternative Hypothesis: Null hypothesis () contains equality; alternative hypothesis () does not.
Select Significance Level (): Common values are 0.05 and 0.01.
Identify the Test Statistic: Choose the appropriate statistic (z, t, chi-square).
Find Values: Calculate the test statistic and P-value or critical value.
Make a Decision: Reject if P-value ; otherwise, fail to reject $H_0$.
Restate Decision in Nontechnical Terms: Address the original claim in simple language.
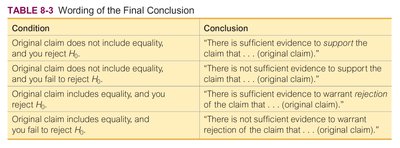
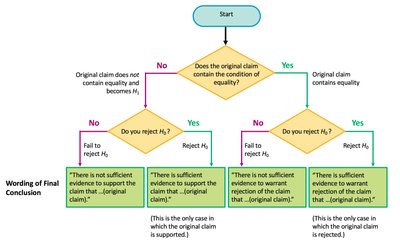
Wording of Final Conclusions
Final conclusions should be stated in clear, nontechnical terms, addressing the original claim.
Condition | Conclusion |
|---|---|
Original claim does not include equality, and you reject | There is sufficient evidence to support the claim that ... (original claim) |
Original claim does not include equality, and you fail to reject | There is not sufficient evidence to support the claim that ... (original claim) |
Original claim includes equality, and you reject | There is sufficient evidence to warrant rejection of the claim that ... (original claim) |
Original claim includes equality, and you fail to reject | There is not sufficient evidence to warrant rejection of the claim that ... (original claim) |
Probability Distributions
Binomial and Poisson Distributions
Binomial Probability:
Poisson Distribution: where
Correlation and Regression
Pearson and Spearman Correlation
Pearson Correlation Coefficient:
Spearman Rank Correlation:
Regression Line
Slope:
Intercept:
Regression Equation:
Chi-Square and Analysis of Variance
Chi-Square Tests
Goodness-of-Fit:
Contingency Table: ,
One-Way Analysis of Variance (ANOVA)
Procedure:
Use software or calculator to obtain results.
Identify the P-value.
Form conclusion: If P-value , reject the null hypothesis of equal means; otherwise, fail to reject.
Statistical Tables
Standard Normal (z) Table
The z-table provides cumulative probabilities for the standard normal distribution. Common critical values:
90% confidence:
95% confidence:
99% confidence:
t Distribution Table
The t-table is used for small samples or when the population standard deviation is unknown. Values depend on degrees of freedom and significance level.
Chi-Square Table
The chi-square table is used for tests of variance, goodness-of-fit, and contingency tables. Values depend on degrees of freedom and area to the right of the critical value.
Correlation Coefficient Tables
Tables for Pearson and Spearman correlation coefficients provide critical values for hypothesis testing.
Summary
This guide covers essential formulas, procedures, and tables for college-level statistics, including descriptive statistics, probability, distributions, confidence intervals, hypothesis testing, correlation, regression, and chi-square/ANOVA methods. Use these notes for exam preparation and reference.
