 Back
BackEstimating a Population Proportion and Confidence Intervals
Study Guide - Smart Notes
 Tailored notes based on your materials, expanded with key definitions, examples, and context.
Estimating a Population Proportion
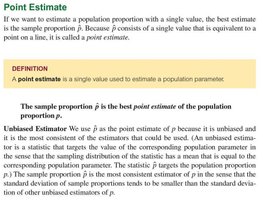
Point Estimate
When estimating a population proportion with a single value, the best estimate is the sample proportion, denoted as \( \hat{p} \). Because \( \hat{p} \) consists of a single value that is equivalent to a point on a line, it is called a point estimate.
Definition: A point estimate is a single value used to estimate a population parameter.
Unbiased Estimator: The sample proportion \( \hat{p} \) is the best point estimate of the population proportion \( p \) because it is unbiased and has the smallest standard deviation among all unbiased estimators of \( p \).
Confidence Intervals for a Proportion
Definition and Interpretation
A confidence interval (CI) is a range of values used to estimate the true value of a population parameter. The confidence interval provides an estimated range that is likely to include the population proportion \( p \) with a certain level of confidence.
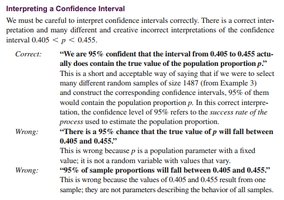
Correct Interpretation: "We are 95% confident that the interval from 0.405 to 0.455 actually does contain the true value of the population proportion \( p \)." This means that if we were to select many different random samples and construct confidence intervals, about 95% of them would contain the true population proportion.
Incorrect Interpretations: It is incorrect to say there is a 95% chance that \( p \) will fall within a specific interval, or that 95% of sample proportions will fall within the interval.
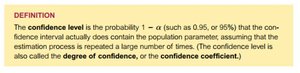
Confidence Level
The confidence level is the probability \( 1 - \alpha \) (such as 0.95 or 95%) that the confidence interval actually contains the population parameter, assuming the estimation process is repeated a large number of times.
The confidence level is also called the degree of confidence or confidence coefficient.
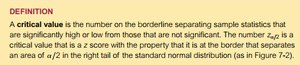
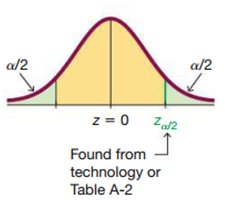
Critical Value
A critical value is the number on the borderline separating sample statistics that are significantly high or low from those that are not significant. The critical value \( z_{\alpha/2} \) is a z-score that separates an area of \( \alpha/2 \) in the right tail of the standard normal distribution.
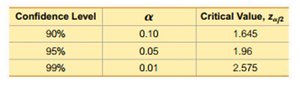
For a 95% confidence level, \( z_{\alpha/2} = 1.96 \).
Other common critical values are shown in the table below:
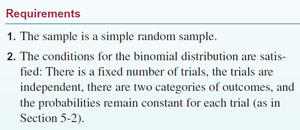
Requirements for Constructing a Confidence Interval for a Proportion
The sample is a simple random sample.
The conditions for the binomial distribution are satisfied: fixed number of trials, independent trials, two categories of outcomes, and constant probability for each trial.
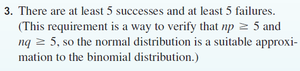
There are at least 5 successes and at least 5 failures (i.e., \( np \geq 5 \) and \( nq \geq 5 \)).
Margin of Error
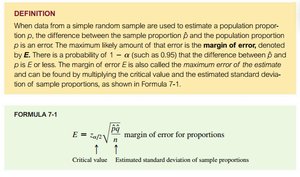
The margin of error (E) is the maximum likely amount of error between the sample proportion \( \hat{p} \) and the population proportion \( p \). It is calculated as:
\( \hat{q} = 1 - \hat{p} \)
The margin of error is used to construct the confidence interval around the point estimate.
Confidence Interval Formula
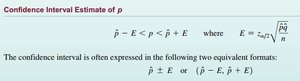
The confidence interval for a population proportion \( p \) is given by:
or equivalently,
Sampling Distribution of Sample Proportions
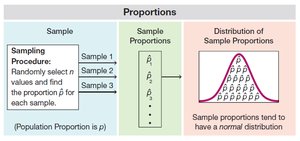
When certain requirements are met, the sampling distribution of sample proportions can be approximated by a normal distribution. This allows us to use z-scores and critical values to construct confidence intervals.
Sample proportions tend to have a normal distribution if the sample size is large enough.
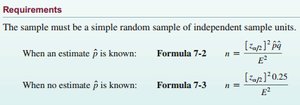
Determining Sample Size for Estimating a Proportion
To achieve a specific margin of error and confidence level, the required sample size can be calculated using the following formulas:
If an estimate \( \hat{p} \) is known:
If no estimate is known, use \( \hat{p} = 0.5 \) for maximum variability:
Applications and Examples
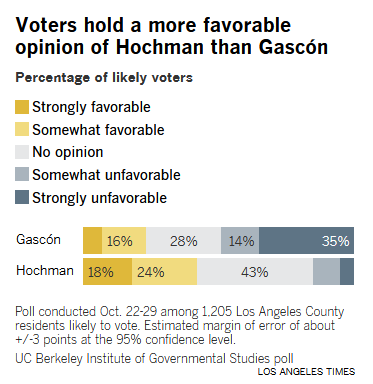
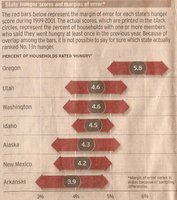
Media Example: Margin of Error in Polls
Polls often report a margin of error to indicate the uncertainty in their estimates. For example, a poll of likely voters may report a margin of error of ±3 percentage points at the 95% confidence level. This means the true proportion is likely within 3 points of the reported value, 95% of the time.
Visualizing Confidence Intervals
Confidence intervals can be visualized as error bars around point estimates. In repeated sampling, about 95% of confidence intervals constructed from different samples will contain the true population proportion if the confidence level is 95%.
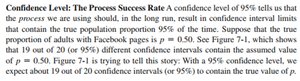
Example: Coin Flips
Suppose you flip a coin 10 times and calculate the sample proportion of heads. You can compute a 90% confidence interval for this point estimate using the formulas above. If your interval contains the true parameter \( p = 0.50 \), your sample is consistent with the expected probability for a fair coin.
Summary Table: Common Confidence Levels and Critical Values
Confidence Level | \( \alpha \) | Critical Value, \( z_{\alpha/2} \) |
|---|---|---|
90% | 0.10 | 1.645 |
95% | 0.05 | 1.96 |
99% | 0.01 | 2.575 |
Key Terms and Definitions
Point Estimate: A single value used to estimate a population parameter.
Confidence Interval (CI): A range of values used to estimate the true value of a population parameter.
Confidence Level: The probability that the CI contains the population parameter.
Critical Value: The z-score that separates the area \( \alpha/2 \) in the tails of the normal distribution.
Margin of Error (E): The maximum likely difference between the sample estimate and the population parameter.
