 Back
BackEstimating Outliers and Their Effect on Correlation
Study Guide - Smart Notes
 Tailored notes based on your materials, expanded with key definitions, examples, and context.
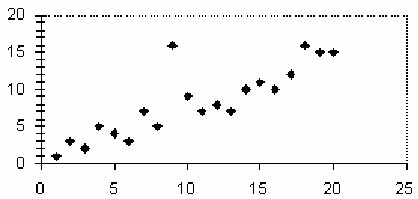
Q18. Estimate the Coordinates of the Outlier on the Graph.
Background
Topic: Outliers in Scatterplots
This question asks you to visually identify an outlier in a scatterplot. Outliers are data points that are noticeably distant from the general pattern of the data.
Key Terms:
Outlier: A data point that is significantly different from other observations.
Scatterplot: A graph that shows the relationship between two quantitative variables.
Step-by-Step Guidance
Examine the scatterplot and look for a point that is far away from the general trend or cluster of the other points.
Estimate the x- and y-coordinates of this point by comparing its position to the labeled axes.
Check if the point is much higher or lower than the rest of the points for a given x-value, or much further left or right for a given y-value.
Write down your estimated coordinates as (x, y).
Try solving on your own before revealing the answer!
Q19. How does the outlier above affect the correlation coefficient?
Background
Topic: Correlation and Outliers
This question tests your understanding of how outliers can influence the correlation coefficient, which measures the strength and direction of a linear relationship between two variables.
Key Terms:
Correlation Coefficient (r): A value between -1 and 1 that indicates the strength and direction of a linear relationship.
Outlier Effect: Outliers can either increase or decrease the correlation coefficient, depending on their position relative to the trend.
Step-by-Step Guidance
Recall that the correlation coefficient is sensitive to outliers, especially those far from the main cluster of data.
Consider whether the outlier is in line with the general trend (which could increase |r|) or deviates from it (which could decrease |r|).
Think about how removing or including the outlier would change the overall linearity of the data.
Decide if the outlier weakens or strengthens the correlation, and why.
Try solving on your own before revealing the answer!
