 Back
BackEstimating Parameters and Determining Sample Sizes
Study Guide - Smart Notes
 Tailored notes based on your materials, expanded with key definitions, examples, and context.
Estimating Parameters and Determining Sample Sizes
Estimating a Population Proportion
Estimating a population proportion is a fundamental task in inferential statistics. When the true population proportion (p) is unknown, we use the sample proportion (\( \hat{p} \)) as a point estimate. The reliability of this estimate is quantified using confidence intervals and the margin of error.
Key Terms and Definitions
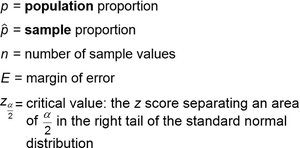
Population Proportion (p): The true proportion of individuals in the population with a certain characteristic.
Sample Proportion (\( \hat{p} \)): The proportion observed in the sample, used to estimate p.
Sample Size (n): The number of observations in the sample.
Margin of Error (E): The maximum expected difference between the point estimate and the true population parameter.
Critical Value (\( z_{\alpha/2} \)): The z-score that separates an area of \( \alpha/2 \) in the right tail of the standard normal distribution.
Confidence Level and Significance Level (\( \alpha \))
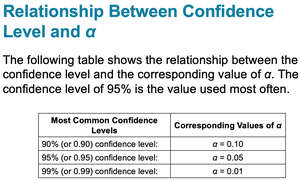
The confidence level is the probability that the confidence interval contains the true population parameter, typically expressed as 90%, 95%, or 99%. The significance level (\( \alpha \)) is the probability that the interval does not contain the parameter.
Most Common Confidence Levels | Corresponding Values of \( \alpha \) |
|---|---|
90% (or 0.90) | \( \alpha = 0.10 \) |
95% (or 0.95) | \( \alpha = 0.05 \) |
99% (or 0.99) | \( \alpha = 0.01 \) |
Confidence Interval for a Population Proportion
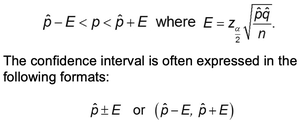
A confidence interval provides a range of plausible values for the population proportion. The general form is:
\( \hat{p} - E < p < \hat{p} + E \)
Where \( E = z_{\alpha/2} \sqrt{\frac{\hat{p}\hat{q}}{n}} \), and \( \hat{q} = 1 - \hat{p} \)
The confidence interval can also be expressed as \( \hat{p} \pm E \) or \( (\hat{p} - E, \hat{p} + E) \).
Interpreting a Confidence Interval
For example, if a 95% confidence interval for p is (0.405, 0.455), we say: "We are 95% confident that the interval from 0.405 to 0.455 actually does contain the true value of the population proportion p."
Critical Values
The critical value \( z_{\alpha/2} \) depends on the desired confidence level. For example, for a 99% confidence level, \( z_{\alpha/2} = 2.576 \).
Margin of Error for Proportions
The margin of error quantifies the uncertainty in the estimate of the population proportion:
\( E = z_{\alpha/2} \sqrt{\frac{\hat{p}\hat{q}}{n}} \)
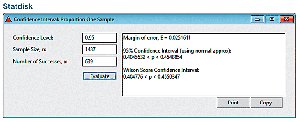
Constructing a Confidence Interval in Statdisk
Statistical software such as Statdisk can be used to compute confidence intervals for proportions. The user inputs the confidence level, sample size, and number of successes, and the software outputs the margin of error and the confidence interval.
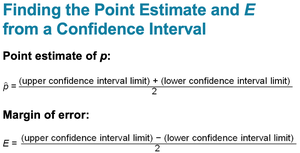
Finding a Sample Proportion and Margin of Error from a Confidence Interval
Given a confidence interval, the point estimate and margin of error can be found as follows:
Point estimate: \( \hat{p} = \frac{\text{upper limit} + \text{lower limit}}{2} \)
Margin of error: \( E = \frac{\text{upper limit} - \text{lower limit}}{2} \)
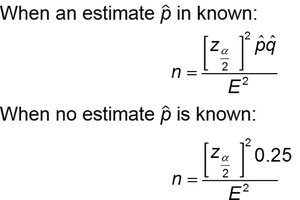
Determining Required Sample Size for Estimating a Population Proportion
To achieve a desired margin of error at a given confidence level, the required sample size can be calculated using:
If an estimate \( \hat{p} \) is known:
If no estimate is known:
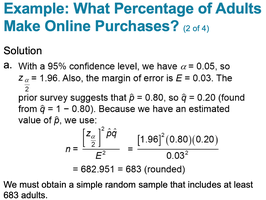
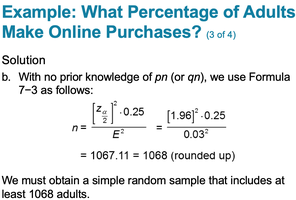
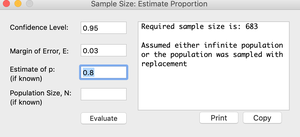
Example: Determining Sample Size for Online Purchases
Suppose we want to estimate the percentage of adults who make online purchases with a margin of error of 3% and 95% confidence.
Case a: If a prior poll shows 80% make purchases, use \( \hat{p} = 0.80 \):
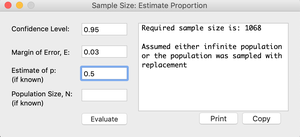
Case b: If no prior information is available, use \( \hat{p} = 0.5 \):
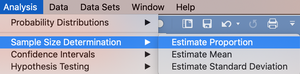
Using Software for Sample Size Determination
Statistical software can automate the calculation of required sample size for a given confidence level, margin of error, and estimated proportion.
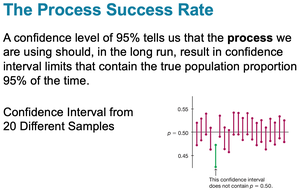
The Process Success Rate
A 95% confidence level means that, in the long run, 95% of confidence intervals constructed from repeated samples will contain the true population proportion.
Estimating a Population Mean
Estimating the population mean (\( \mu \)) involves constructing a confidence interval around the sample mean (\( \bar{x} \)). The approach depends on whether the population standard deviation (\( \sigma \)) is known or unknown.
Case 1: \( \sigma \) Known
Confidence interval:
Margin of error:
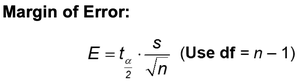
Case 2: \( \sigma \) Unknown
Use the sample standard deviation (s) and the Student t-distribution with degrees of freedom \( n-1 \).
Confidence interval:
Margin of error:
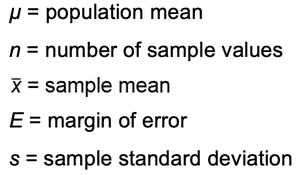
Key Terms for Estimating a Mean
\( \mu \): Population mean
\( n \): Number of sample values
\( \bar{x} \): Sample mean
\( E \): Margin of error
\( s \): Sample standard deviation
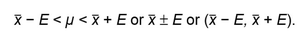
Expressing the Confidence Interval
The confidence interval for the mean can be written as:
\( \bar{x} - E < \mu < \bar{x} + E \)
or \( \bar{x} \pm E \)
or \( (\bar{x} - E, \bar{x} + E) \)
Choosing an Appropriate Distribution
If \( \sigma \) is known and the population is normal or \( n > 30 \), use the normal (z) distribution.
If \( \sigma \) is unknown and the population is normal or \( n > 30 \), use the t-distribution with \( n-1 \) degrees of freedom.
Summary Table: Confidence Intervals for Proportions and Means
Parameter | Known/Unknown | Distribution | Margin of Error Formula |
|---|---|---|---|
Proportion (p) | n/a | Normal (z) | |
Mean (\( \mu \)) | \( \sigma \) known | Normal (z) | |
Mean (\( \mu \)) | \( \sigma \) unknown | t-distribution |
Additional info: The formulas and procedures above are foundational for inferential statistics, allowing researchers to make reliable statements about population parameters based on sample data. The use of statistical software is common for these calculations in practice.
