 Back
BackEstimating Parameters: Confidence Intervals for the Population Mean
Study Guide - Smart Notes
 Tailored notes based on your materials, expanded with key definitions, examples, and context.
Estimating Parameters
Population Mean
Estimating the population mean is a fundamental task in inferential statistics. When the population standard deviation is unknown, special methods are required to construct confidence intervals for the mean.
Estimating the Population Mean When the Population Standard Deviation is Not Known
Key Concepts
Simple Random Sample: The sample must be drawn randomly from the population.
Normality Requirement: Either the population is normally distributed, or the sample size is large (n > 30), which allows the Central Limit Theorem to apply.
The Student's t-Distribution
Definition and Properties
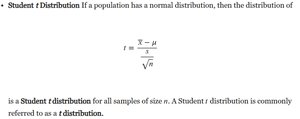
The Student's t-distribution is used when estimating the population mean from a small sample and the population standard deviation is unknown. It is similar to the standard normal distribution but has heavier tails, which accounts for the extra uncertainty from estimating the standard deviation.
The t-distribution is symmetric and bell-shaped, centered at zero.
As the sample size increases, the t-distribution approaches the standard normal distribution.
The formula for the t statistic is:
Degrees of Freedom
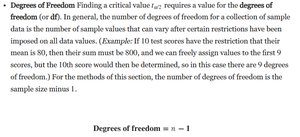
The degrees of freedom (df) for the t-distribution is the sample size minus one. It reflects the number of independent values that can vary in the calculation of a statistic.
For a sample of size n, degrees of freedom:
Degrees of freedom affect the shape of the t-distribution: fewer degrees of freedom result in heavier tails.
Example: If 10 test scores must sum to 800, only 9 can vary freely; thus, df = 9.
Comparing t-Distribution and Normal Distribution
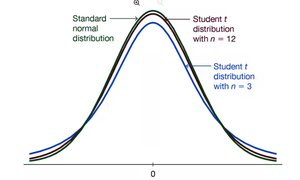
The t-distribution is wider and has heavier tails than the standard normal distribution, especially for small sample sizes. As the sample size increases, the t-distribution becomes more similar to the normal distribution.
Constructing a Confidence Interval for the Population Mean
Confidence Interval Formula
To estimate the population mean when the population standard deviation is unknown, use the t-distribution to construct a confidence interval:
= sample mean
= sample standard deviation
= sample size
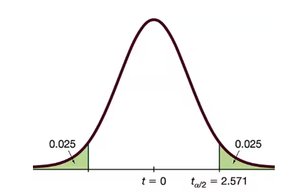
= critical value from the t-distribution for the desired confidence level and degrees of freedom
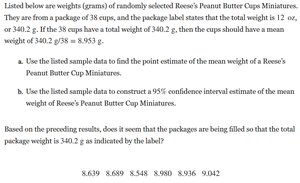
Example: Constructing a Confidence Interval
Suppose you have the following sample weights (in grams) for 8 Reese's Peanut Butter Cup Miniatures: 8.639, 8.689, 8.548, 8.980, 8.936, 9.042. Use these data to:
Find the point estimate of the mean weight.
Construct a 95% confidence interval for the mean weight.
Interpret whether the packages are being filled as indicated by the label (total weight 340.2 g for 38 cups, so mean should be 8.953 g).
Choosing the Appropriate Method for Estimating the Mean
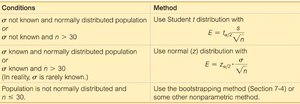
Summary Table: Conditions and Methods
The method for constructing a confidence interval depends on whether the population standard deviation is known and whether the population is normally distributed.
Conditions | Method |
|---|---|
σ not known and normally distributed population or σ not known and n > 30 | Use Student t distribution with |
σ known and normally distributed population or σ known and n > 30 (in reality, σ is rarely known.) | Use normal (z) distribution with |
Population is not normally distributed and n < 30 | Use the bootstrapping method or some other nonparametric method. |
Estimating Population Proportion When the Population Standard Deviation is Known
When the population standard deviation is known, the confidence interval for the mean is constructed using the standard normal (z) distribution rather than the t-distribution.
The formula for the margin of error is:
Finding Sample Size
Determining the appropriate sample size is crucial for ensuring that the confidence interval has the desired precision. The sample size can be calculated based on the desired margin of error, confidence level, and population variability.
For estimating a mean, the formula is:
For estimating a proportion, a similar formula is used, substituting the estimated proportion and its complement for the standard deviation.
