 Back
BackEstimating Population Means and Confidence Intervals
Study Guide - Smart Notes
 Tailored notes based on your materials, expanded with key definitions, examples, and context.
Estimating Population Means
Introduction
Estimating the population mean is a fundamental task in inferential statistics. This section covers how to construct confidence intervals for the population mean when the population standard deviation is known and unknown, and how to estimate the required sample size for a desired margin of error.
Point Estimate & z-score
Point Estimate: The best point estimate of a population mean (μ) is the sample mean (\( \bar{x} \)). z-score: The z-score measures how many standard deviations a data point is from the mean. It is used when the population standard deviation (σ) is known.
Confidence Intervals
A confidence interval provides a range of values that is likely to contain the population mean with a specified level of confidence (e.g., 95%).
When σ is known: Use the z-distribution.
When σ is unknown: Use the t-distribution.
The general formula for a confidence interval for the mean is:
Where the standard error is:
(if σ is known) (if σ is unknown, using sample standard deviation s)
Margin of Error
The margin of error (E) quantifies the maximum expected difference between the true population parameter and a sample estimate. For a confidence interval for the mean:
Known σ:
Unknown σ:
Example (Known σ)
Suppose a random sample of 100 men has a mean weight of 172.55 lb, and the population standard deviation is known to be 26 lb.
a. Point Estimate: The best point estimate of the population mean is 172.55 lb.
b. 95% Confidence Interval: Confidence interval:
c. Interpretation: The 1960 mean weight of 166.3 lb is below the lower bound of the current confidence interval, suggesting the mean weight has increased since then.
Choosing the Sample Size
To estimate the population mean with a specified margin of error (E) and confidence level, the required sample size is:
If σ is unknown, use a preliminary estimate or the sample standard deviation.
What if σ is Unknown?
When the population standard deviation is unknown, the Student t-distribution is used instead of the normal distribution. The t-distribution is wider and has heavier tails, especially for small sample sizes.
Student t Distributions
The t-distribution depends on the degrees of freedom (df), which is typically n - 1 for a sample of size n. As the sample size increases, the t-distribution approaches the standard normal distribution.
Degrees of Freedom (df): The number of independent values that can vary in the calculation of a statistic, calculated as n - 1 for a sample mean.
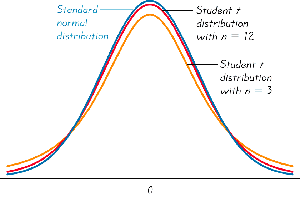
Interpretation: The t-distribution is more spread out for smaller sample sizes (e.g., n=3) and becomes closer to the normal distribution as n increases (e.g., n=12).
Finding Critical Values for t Distributions
The critical value for the t-distribution, denoted as tα/2, depends on the desired confidence level and the degrees of freedom. These values are found in t-tables or calculated using statistical software.
Margin of Error (Unknown σ)
When σ is unknown, the margin of error for the confidence interval is:
where s is the sample standard deviation.
Choosing the Appropriate Distribution
To decide whether to use the z-distribution or t-distribution for constructing confidence intervals for the mean, follow this decision process:
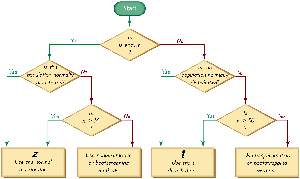
If the population standard deviation (σ) is known and the sample is random and either the population is normal or n ≥ 30, use the z-distribution.
If σ is unknown and the sample is random and either the population is normal or n ≥ 30, use the t-distribution.
If the sample is not random or the population is not normal and n < 30, other methods may be required.
Summary Table: Choosing the Appropriate Distribution
Condition | Distribution to Use |
|---|---|
σ known, n ≥ 30 or normal population | z-distribution |
σ unknown, n ≥ 30 or normal population | t-distribution |
Sample not random or population not normal, n < 30 | Other methods |
Additional info: The t-distribution is robust to moderate departures from normality, especially as sample size increases.
