Back
BackEstimating Population Parameters: Proportion, Mean, and Standard Deviation
Study Guide - Smart Notes
 Tailored notes based on your materials, expanded with key definitions, examples, and context.
Estimating a Population Proportion
Point Estimate for the Population Proportion
A point estimate is a single value statistic that serves as the best guess for an unknown population parameter. For the population proportion, the point estimate is given by:
Formula: , where is the number of individuals in the sample with a specified characteristic and is the sample size.
Example: In a poll of 1783 voters, 1123 favored the death penalty. The point estimate is .
Confidence Interval for the Population Proportion
A confidence interval provides a range of plausible values for a population parameter, based on a point estimate and a margin of error. The level of confidence (e.g., 95%) indicates the expected proportion of such intervals that will contain the true parameter in repeated sampling.
General Form: Point estimate margin of error
Margin of Error Formula:
Confidence Interval Formula:
(Lower bound) (Upper bound)
Conditions: and (sample size is less than 5% of the population).
Interpretation: A (1 – )·100% confidence interval means that this proportion of intervals from repeated samples will contain the true parameter.
Example: For , , (for 90% confidence): Lower: Upper: "We are 90% confident that the true proportion is between 0.61 and 0.65."
Determining Sample Size for Estimating a Proportion
To estimate a population proportion within a specified margin of error and confidence level, the required sample size is:
Formula (with prior estimate ):
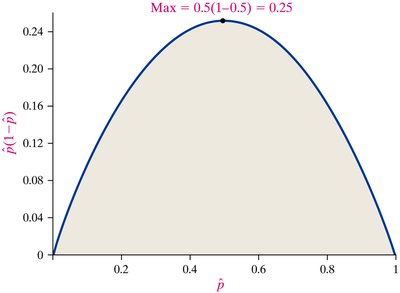
If no prior estimate: Use for maximum sample size:
Example: To estimate the proportion of English-only speakers within 3% (E = 0.03) at 90% confidence (), with prior : (round up to 437)
Estimating a Population Mean
Point Estimate for the Population Mean
The sample mean () is the point estimate for the population mean ():
Formula:
Example: For 17 pennies with weights (in grams):
Student’s t-Distribution
When estimating the mean from a normally distributed population with unknown standard deviation, the Student’s t-distribution is used:
t-statistic:
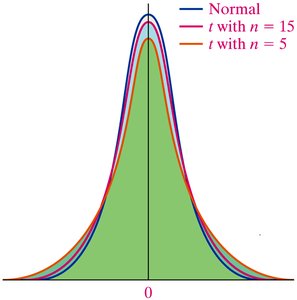
Properties:
Different for each degree of freedom ()
Symmetric and centered at 0
More area in the tails than the normal distribution (especially for small )
As increases, t-distribution approaches the normal distribution
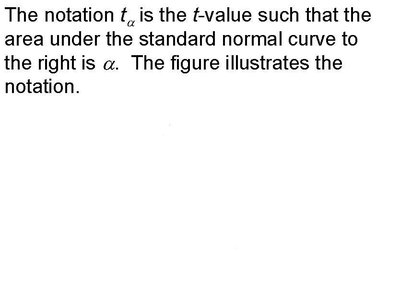
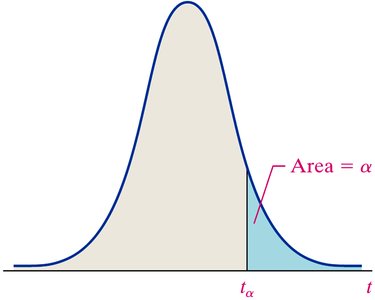
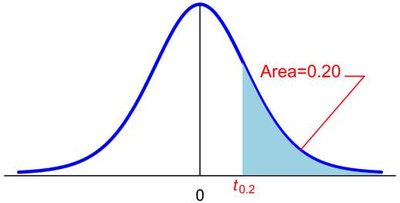
Finding t-Values
The notation refers to the t-value such that the area under the t-distribution curve to the right is .
Confidence Interval for the Population Mean
To construct a (1 – )·100% confidence interval for :
Conditions: Simple random sample, , population normal or large
Formula:
Lower bound: Upper bound:
Interpretation: For a 95% confidence interval, about 95% of such intervals from repeated samples will contain .
Example: For pennies, , , , (99% confidence): Lower: Upper: "We are 99% confident that the mean weight is between 2.452 and 2.476 grams."
Determining Sample Size for Estimating a Mean
To estimate within margin of error at a given confidence level:
Formula: (round up to nearest integer)
Example: To estimate penny weight within 0.005 grams at 99% confidence (, ): (round up to 107)
Estimating a Population Standard Deviation or Variance
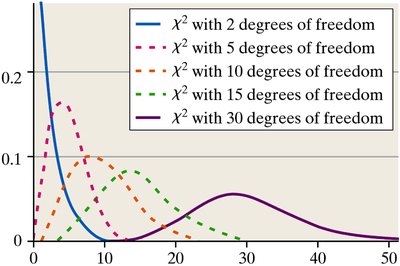
Chi-Square Distribution
For a normally distributed population, the statistic follows a chi-square distribution with degrees of freedom.
Properties:
Not symmetric
Shape depends on degrees of freedom
All values are nonnegative
Becomes more symmetric as degrees of freedom increase
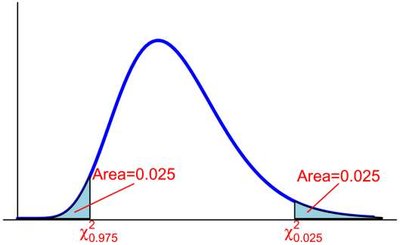
Finding Critical Values for the Chi-Square Distribution
Critical values and separate the middle (1 – )·100% of the distribution from the tails.
Example: For 18 degrees of freedom, ,
Confidence Interval for Population Variance and Standard Deviation
For a simple random sample from a normal population, a (1 – )·100% confidence interval for is:
Lower bound:
Upper bound:
For , take the square root of the bounds.
Example: For Microsoft stock returns (, ), , : Lower: Upper: "We are 90% confident that the standard deviation is between 13.04 and 47.01."
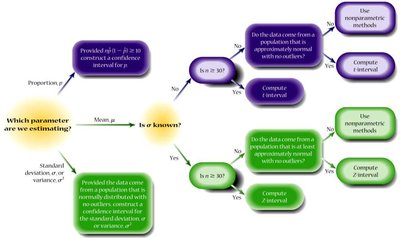
Choosing the Appropriate Estimation Procedure
To determine which estimation procedure to use (proportion, mean, or standard deviation/variance), consider the parameter of interest, sample size, and whether the population is normal or approximately normal.