 Back
BackEstimating Population Proportions and Determining Sample Sizes
Study Guide - Smart Notes
 Tailored notes based on your materials, expanded with key definitions, examples, and context.
Estimating Parameters & Determining Sample Sizes
Estimating a Population Proportion
Estimating a population proportion is a fundamental task in inferential statistics, allowing us to make conclusions about a population based on sample data. This process involves point estimates, confidence intervals, and determining appropriate sample sizes for desired accuracy.
Proportions and Their Sampling Distribution
Population Proportion (p): The true proportion of individuals in a population with a certain characteristic.
Sample Proportion (\( \hat{p} \)): The proportion observed in a sample, calculated as \( \hat{p} = \frac{x}{n} \), where x is the number of successes and n is the sample size.
Sampling Distribution: The distribution of sample proportions from all possible samples of a given size. For large enough samples (when \( np > 5 \) and \( nq > 5 \)), this distribution is approximately normal.
Mean and Standard Deviation of the Sampling Distribution
Mean: \( \mu_{\hat{p}} = p \)
Standard Deviation: \( \sigma_{\hat{p}} = \sqrt{\frac{pq}{n}} \), where \( q = 1 - p \)
Central Limit Theorem for Proportions
The sampling distribution of \( \hat{p} \) is approximately normal if \( np > 5 \) and \( nq > 5 \).
This allows the use of the normal distribution to construct confidence intervals for proportions.
Estimating Parameters: Point Estimates & Confidence Intervals
To estimate a population parameter, we use sample data to construct a range of plausible values (confidence interval) and a single best guess (point estimate).
Point Estimate: The single value estimate of a population parameter (e.g., \( \hat{p} \) for population proportion).
Confidence Interval (CI): A range of values, derived from the sample, that is likely to contain the population parameter with a specified probability.
Confidence Level: The probability (e.g., 90%, 95%, 99%) that the CI contains the true parameter value in repeated sampling. Common choices are 90% (\( \alpha = 0.10 \)), 95% (\( \alpha = 0.05 \)), and 99% (\( \alpha = 0.01 \)).
Margin of Error
The margin of error (E) quantifies the maximum expected difference between the point estimate and the true population parameter at a given confidence level.
For a population proportion, the margin of error is calculated as: where \( \hat{q} = 1 - \hat{p} \) and \( z_{\alpha/2} \) is the critical value from the standard normal distribution.
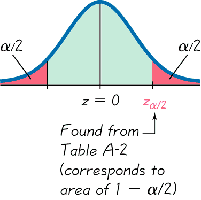
Critical Values and Confidence Intervals
Critical Value (\( z_{\alpha/2} \)): The z-score that corresponds to the desired confidence level, with \( \alpha/2 \) in each tail of the normal distribution.
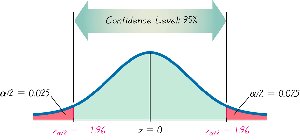
For a 95% confidence level, \( \alpha = 0.05 \), so \( \alpha/2 = 0.025 \) in each tail.
Confidence Interval Formula for Proportion:
Example: Constructing a Confidence Interval
Suppose in a survey of 1013 adults, 669 report worrying about identity theft.
Point Estimate: \( \hat{p} = \frac{669}{1013} \approx 0.661 \)
For a 95% confidence level, find the margin of error and construct the confidence interval:
\( z_{0.025} \approx 1.96 \)
\( E = 1.96 \times \sqrt{\frac{0.661 \times 0.339}{1013}} \approx 0.029 \)
Confidence interval: \( 0.661 \pm 0.029 = (0.632, 0.690) \)
Interpretation: We are 95% confident that the true proportion of adults who worry about identity theft is between 63.2% and 69.0%.
Interpreting Confidence Intervals
A 95% confidence level means that, in the long run, 95% of similarly constructed intervals will contain the true population proportion.
Incorrect Interpretation: "There is a 95% chance that the true proportion is in this interval." (The true proportion is fixed; the interval varies.)
Incorrect Interpretation: "95% of sample proportions will fall in this interval." (The interval estimates the population proportion, not other samples.)
Margin of Error, Confidence Level, and Sample Size
Margin of Error vs. Confidence Level: Increasing the confidence level increases the margin of error (interval becomes wider).
Margin of Error vs. Sample Size: Increasing the sample size decreases the margin of error (interval becomes narrower).
Determining Sample Size for Estimating a Proportion
To achieve a desired margin of error at a specific confidence level, the required sample size can be calculated using:
If an estimate of \( p \) is available:
If no estimate is available, use \( \hat{p} = 0.5 \) for maximum variability.
Example: Determining Sample Size
How many adults must be surveyed to be 90% confident that the sample percentage is in error by no more than 3 percentage points (E = 0.03)?
Suppose previous research suggests \( p \approx 0.27 \):
