 Back
BackEstimating Population Proportions: Confidence Intervals and Sample Size
Study Guide - Smart Notes
 Tailored notes based on your materials, expanded with key definitions, examples, and context.
Estimating Parameters
Population Proportion
Estimating the population proportion is a fundamental task in inferential statistics. The population proportion, denoted as p, represents the fraction of individuals in a population possessing a certain characteristic. In practice, we use sample data to estimate this proportion.
Confidence Intervals
Definition and Purpose
A confidence interval (CI) is a range of values used to estimate the true value of a population parameter. It provides a measure of uncertainty associated with the sample estimate, indicating how likely it is that the interval contains the actual population parameter.
Confidence Level
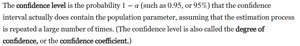
The confidence level is the probability, denoted as 1 - \alpha (such as 0.95 or 95%), that the confidence interval actually contains the population parameter, assuming the estimation process is repeated many times. It is also called the degree of confidence or confidence coefficient.
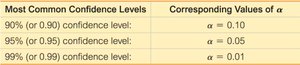
90% confidence level: \( \alpha = 0.10 \)
95% confidence level: \( \alpha = 0.05 \)
99% confidence level: \( \alpha = 0.01 \)
Critical Values
For the standard normal distribution, a critical value is a z score that separates significantly low or high values. The critical value \( z_{\alpha/2} \) is used to construct confidence intervals for proportions.
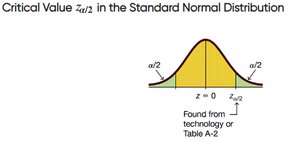
For a 95% confidence level, the critical value is \( z_{0.025} = 1.96 \), since \( \alpha/2 = 0.025 \).
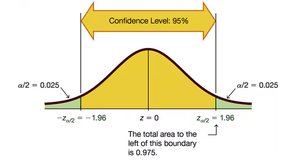
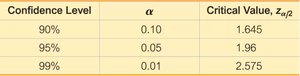
Table: Confidence Levels and Critical Values
Confidence Level | \( \alpha \) | Critical Value, \( z_{\alpha/2} \) |
|---|---|---|
90% | 0.10 | 1.645 |
95% | 0.05 | 1.96 |
99% | 0.01 | 2.575 |
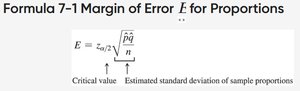
Margin of Error
Definition and Formula
The margin of error, denoted by E, is the maximum likely amount of error by which the sample statistic misses the population parameter. It quantifies the uncertainty in the estimate.
The formula for the margin of error for proportions is:
where:
\( z_{\alpha/2} \): Critical value from the standard normal distribution
\( \hat{p} \): Sample proportion
\( \hat{q} = 1 - \hat{p} \): Complement of the sample proportion
\( n \): Sample size
Confidence Interval for Estimating a Population Proportion
Requirements
To use the normal approximation for constructing a confidence interval for a population proportion, the following requirements must be met:
The sample is a simple random sample.
The conditions for the binomial distribution are satisfied: fixed number of trials, independent trials, two categories of outcomes, and constant probabilities.
There are at least 5 successes and at least 5 failures (i.e., \( np \geq 5 \) and \( nq \geq 5 \)).
Interpretation of Confidence Intervals
When interpreting a confidence interval, it is important to state the confidence level and the parameter being estimated. For example, "We are 95% confident that the true proportion of students who take online courses is between 0.50 and 0.56."
Finding a Sample Size
Determining Sample Size for a Desired Margin of Error
To estimate a population proportion with a specified margin of error and confidence level, the required sample size can be calculated using the formula:
If no prior estimate of \( \hat{p} \) is available, use \( \hat{p} = 0.5 \) to maximize the required sample size.
Worked Examples and Applications
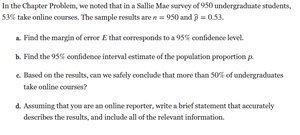
Example: Estimating Proportion of Online Course Enrollment
Suppose a survey of 950 undergraduate students found that 53% take online courses. The sample results are \( n = 950 \) and \( \hat{p} = 0.53 \).
a. Find the margin of error \( E \) for a 95% confidence level.
b. Find the 95% confidence interval estimate of the population proportion \( p \).
c. Based on the results, can we conclude that more than 50% of undergraduates take online courses?
d. Write a brief statement describing the results, including all relevant information.
Example: Medical Study Confidence Interval
In a medical study, 70% of 71 subjects were abstinent from smoking at 8 weeks (95% confidence interval: 58% to 81%). Use this information to find the point estimate \( \hat{p} \) and the margin of error \( E \).
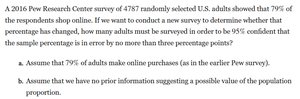
Example: Determining Sample Size for Survey
A Pew Research Center survey found that 79% of 4787 randomly selected U.S. adults shop online. To determine how many adults must be surveyed to be 95% confident that the sample percentage is in error by no more than three percentage points:
Assume that 79% of adults make online purchases.
Assume no prior information about the population proportion.
Apply the sample size formula for each scenario.
Summary Table: Key Concepts in Estimating Population Proportions
Concept | Definition | Formula |
|---|---|---|
Confidence Interval | Range of values estimating a population parameter | |
Margin of Error | Maximum likely error in estimate | |
Sample Size | Number of subjects needed for desired margin of error |
Additional info: Academic context and formulas have been expanded for completeness and clarity. Tables have been recreated and summarized for study purposes.
