 Back
Exploring Data with Tables and Graphs: Frequency Distributions and Comparative Analysis
Study Guide - Smart Notes
 Tailored notes based on your materials, expanded with key definitions, examples, and context.
Describing Data with Tables and Graphs
Frequency Distributions for Organizing and Summarizing Data
Frequency distributions are essential tools in statistics for organizing and summarizing large data sets. They help reveal the underlying patterns and distribution of the data, making it easier to interpret and analyze.
Frequency Distribution (or Frequency Table): Shows how data are partitioned among several categories (or classes) by listing the categories along with the number (frequency) of data values in each.
Purpose: To organize raw data into a more comprehensible format, highlighting the distribution and frequency of values.
Key Terms in Frequency Distributions
Lower Class Limits: The smallest numbers that can belong to each of the different classes.
Upper Class Limits: The largest numbers that can belong to each of the different classes.
Class Boundaries: The numbers used to separate the classes, eliminating gaps between class intervals.
Class Width: The difference between two consecutive lower class limits in a frequency distribution. Formula:
Class Midpoints: The values in the middle of the classes, calculated as:
Procedure for Constructing a Frequency Distribution
Select the number of classes (usually between 5 and 20).
Calculate the class width and round up to a convenient number.
Choose the first lower class limit (often the minimum value or a convenient value below it).
List the lower class limits, adding the class width successively.
Determine the upper class limits for each class.
Tally each data value into the appropriate class and count the frequencies.
Example: McDonald’s Lunch Service Times
The following data set represents drive-through service times (in seconds) for McDonald’s lunches:

Following the procedure, the frequency distribution is constructed as follows:
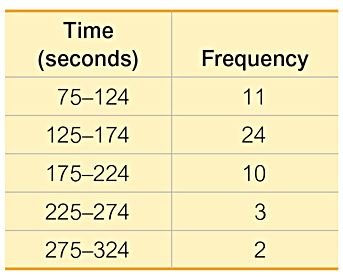
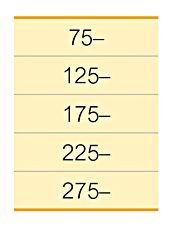
Lower class limits are listed vertically to help identify corresponding upper class limits:
The final frequency table summarizes the data:
Relative Frequency and Cumulative Frequency Distributions
Relative Frequency Distribution: Each class frequency is replaced by a relative frequency (proportion) or a percentage. Formula:
Percentage Frequency: The relative frequency expressed as a percentage. Formula:
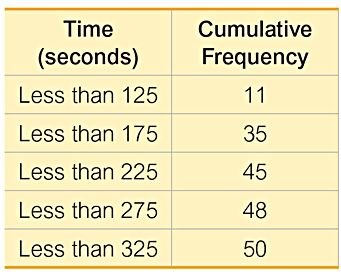
Cumulative Frequency Distribution: The frequency for each class is the sum of the frequencies for that class and all previous classes.
Example of a cumulative frequency distribution for McDonald’s lunch service times:
Interpreting Frequency Distributions
Normal Distribution: Frequencies start low, increase to a maximum, and then decrease, forming a roughly symmetric pattern.
Gaps: The presence of gaps in a frequency distribution can indicate data from two or more different populations.
Example: Exploring Data with Gaps
The following table shows the frequency distribution of the weights of randomly selected pennies:
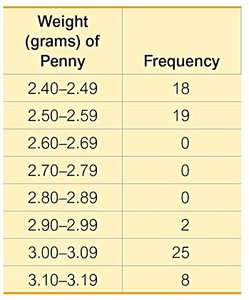
A large gap between the lightest and heaviest pennies suggests two populations: pennies made after 1983 (mostly zinc) and those made before 1983 (mostly copper).
Comparing Data Sets Using Relative Frequency Distributions
Combining two or more relative frequency distributions in one table facilitates comparison between data sets.
Example: Comparing McDonald’s and Dunkin’ Donuts Service Times
The table below compares the relative frequency distributions for drive-through lunch service times at McDonald’s and Dunkin’ Donuts:
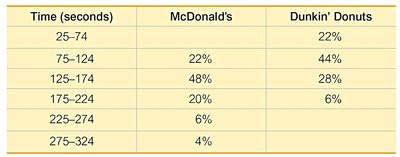
By comparing the relative frequencies, it is evident that Dunkin’ Donuts generally has lower service times than McDonald’s.
