 Back
Exploring Data with Tables and Graphs: Introductory Statistics Study Notes
Study Guide - Smart Notes
 Tailored notes based on your materials, expanded with key definitions, examples, and context.
Frequency Distributions
Constructing Frequency Distributions
Frequency distributions are fundamental tools for organizing quantitative data into classes or categories. They help reveal patterns and characteristics of the data set.
Step 1: Select the number of classes (usually 5–20). Convenience and round numbers are preferred.
Step 2: Calculate class width: Round up for convenience.
Step 3: Choose the first lower class limit (minimum value or a convenient value below it).
Step 4: List other lower class limits by adding the class width successively.
Step 5: Enter upper class limits for each class.
Step 6: Tally each data value in the appropriate class and sum for frequency.
Classes should not overlap, and each value must belong to exactly one class. All classes, even those with zero frequency, should be included.
Relative and Percentage Frequency Distributions
Relative frequency distributions replace class frequencies with proportions or percentages, facilitating comparison between data sets.
Relative frequency:
Percentage frequency:
The sum of percentages should be close to 100% (allowing for rounding errors).
Normal and Skewed Distributions
Frequency distributions can reveal the shape of the data, such as normal (bell-shaped), uniform, or skewed distributions.
Normal Distribution: Frequencies start low, increase to a peak, then decrease, forming a symmetric shape.
Skewed Distribution: Not symmetric; extends more to one side. Right-skewed (positively skewed) has a longer right tail; left-skewed (negatively skewed) has a longer left tail.
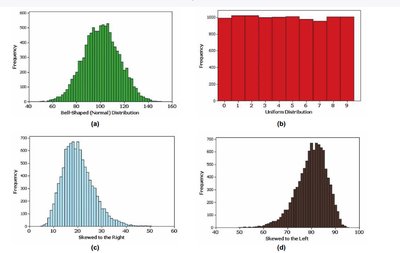
Gaps in distributions may indicate data from multiple populations.
Normal Quantile Plots
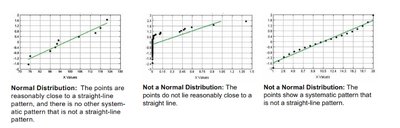
Normal quantile plots are used to assess whether a data set follows a normal distribution.
If points lie close to a straight line, the distribution is normal.
Systematic deviations from a straight line indicate non-normality.
Graphical Methods for Data Exploration
Histograms
A histogram is a bar graph for quantitative data, where bars are adjacent and represent frequency or relative frequency.
Horizontal axis: classes of data values
Vertical axis: frequency or relative frequency
Objective: Understand data characteristics
Dotplots
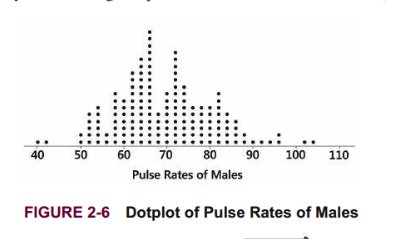
Dotplots display each data value as a dot above a horizontal scale. Dots are stacked for repeated values.
Shows the shape of the distribution
Allows reconstruction of original data values
Stemplots (Stem-and-Leaf Plots)
Stemplots separate each value into a stem and a leaf, often after rounding data values.
Shows distribution shape
Retains original data values
Data are sorted
Time-Series Graphs
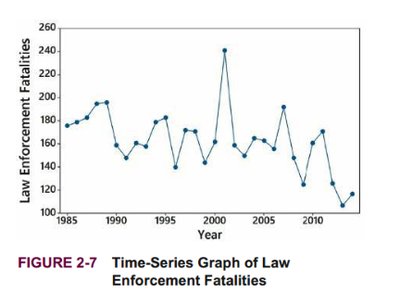
Time-series graphs plot quantitative data collected at different points in time, revealing trends and changes.
Useful for identifying patterns over time
Bar Graphs
Bar graphs use bars of equal width to show frequencies of categories for categorical (qualitative) data.
Shows relative distribution of categories
Bars may be separated by gaps
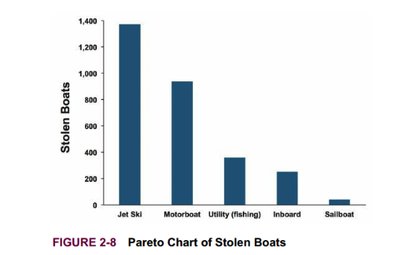
Pareto Charts
Pareto charts are bar graphs for categorical data, with bars arranged in descending order of frequency.
Highlights most important categories
Facilitates comparison of categories
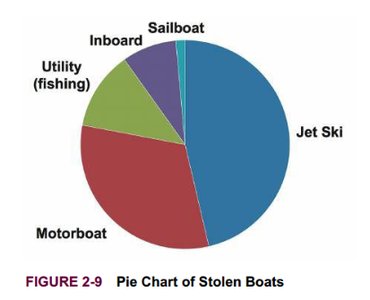
Pie Charts
Pie charts depict categorical data as slices of a circle, with slice size proportional to frequency. They are common but less effective than Pareto charts.
Shows distribution of categorical data
Not recommended for statistical analysis due to lack of scale and inefficiency
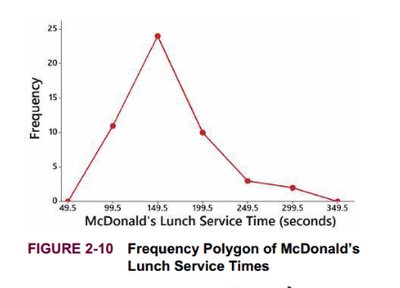
Frequency Polygons
Frequency polygons use line segments connected to points above class midpoints, similar to histograms but with lines instead of bars.
Can use relative frequencies for comparison
Multiple frequency polygons can be plotted for easy comparison
Deceptive Graphs and Pictographs
Graphs can be misleading if the vertical scale does not start at zero or if pictographs exaggerate differences using area or volume.
Doubling the sides of a square increases area by four times
Doubling the sides of a cube increases volume by eight times
Correlation and Regression
Scatterplots
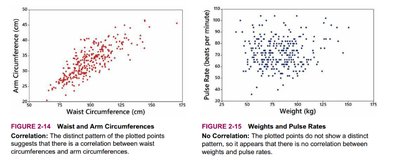
Scatterplots display paired (x, y) quantitative data, with the x-axis for the first variable and y-axis for the second.
Used to assess correlation between variables
Linear correlation: points form a pattern approximated by a straight line
Correlation does not imply causation
Regression Line
The regression line (line of best fit) is the straight line that best fits the scatterplot of paired data, often determined by the least-squares method.
Used for prediction and analysis of relationships
Key Vocabulary
Center: A value representing the middle of the data set.
Variation: The degree to which data values differ.
Distribution: The shape or spread of data values.
Outliers: Values far from the majority of the data.
Time: Changes in data characteristics over time.
Frequency Distribution: Table showing categories and frequencies.
Lower/Upper Class Limits: Smallest/largest values in each class.
Class Boundaries: Numbers separating classes without gaps.
Class Midpoints: Middle value of each class:
Class Width: Difference between consecutive lower class limits.
Cumulative Frequency Distribution: Frequency for each class is the sum of that class and all previous classes.
Example: Constructing a cumulative frequency distribution: If the first frequency is 1, the cumulative frequency is 1; if the next is 2, the cumulative frequency is 3, and so on.
